
In this tutorial, we’ll show you how to create relationships between tables in Microsoft Power BI. The good news is that you do this with a click and point wizard—eliminating the need to write any SQL commands.
(This article is part of our Power BI Guide. Use the right-hand menu to navigate.)
Relationships in Power BI
In Power BI, a relationship documents the common elements between tables.
In the example we’ll use here, we have two tables from a sales system: customers and orders.
- The common element is the customerNumber.
- The customer table contains the customer name.
- The orders table contains order amount, product sold, etc.
So, if you want to print the customer name on a sales report, for instance, you need to tell BI what columns link these two tables.
Sample data
To follow along with our example, download this data:
Import the two tables.
Relationship types
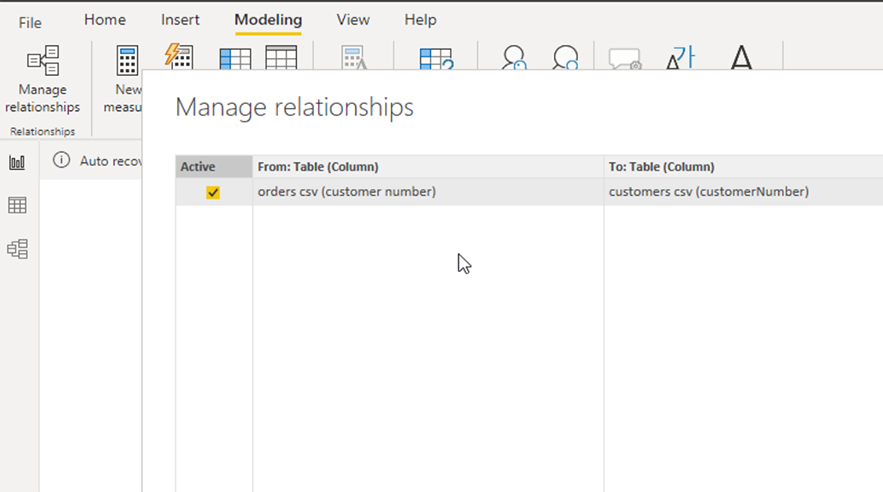
From the screen where you imported the data sources, click the Manage Relationships button. BI will guess what elements are in common. Since customerName is in both tables, it picks that. You can edit this if you need to change it.
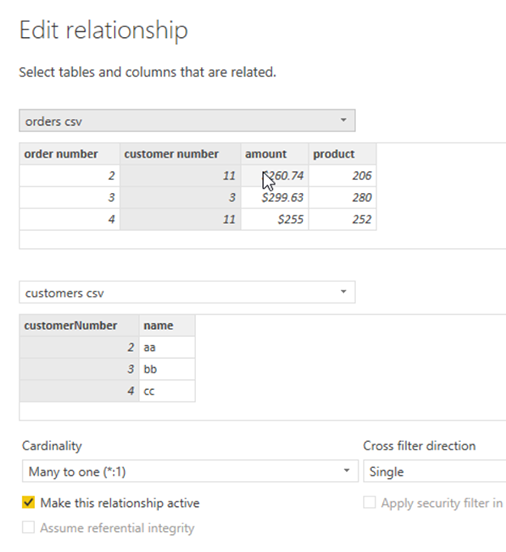
The Edit button lets you edit the cardinality of the relationship. There are three types:
- One-to-one. For each row in the left-hand table there is one and only one row in the right-hand table.
- One-to-many. This is the most common scenario. It means for each row in one of the tables, there are more than one row in the other table. Which table is which depends on which you put on the left or the right. For our orders and customers tables, there are many (more than one) rows in the orders table for each row in the customers table.
- Many-to-many. Think of this as a one-to-many relationship, but in both directions. For example, imagine a doctor who both prescribes medicines but also takes medicines. Many-to-many is not commonly used.
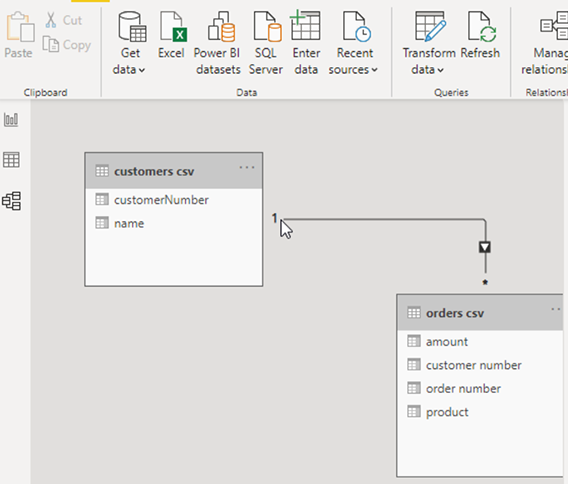
Click the third icon on the left and you get a visual view of the table relationships.
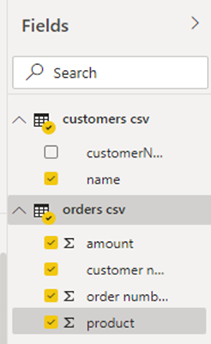
Now, go to the report layout screen and select the table type layout.
We see that customers and table tables are on the right-hand side. You pick the columns you want on the table from each. We pick the order information from the orders table, then the customer name from the customers table.
Because BI now understands how the two tables are related, it knows how to find the customer name given the customer number in the order table.
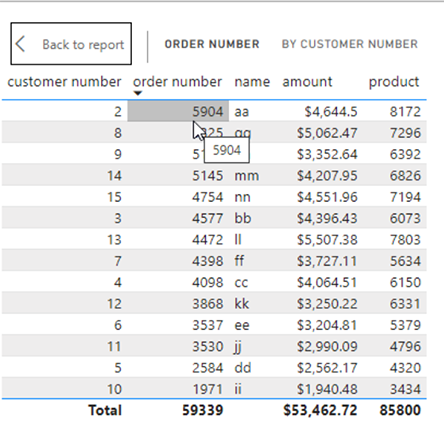
The report created is a bit small. Click on Focus Mode on the report to zoom in to make it larger.
Here you can see the Power BI has retrieved the customer name column from the customer table. In other words, it used the relationship to look this up.
That concludes this tutorial.
Related reading
- BMC Machine Learning & Big Data Blog
- Data Visualization Guide, a series of tutorials on various products
- Tableau Online Guide
- Data Storage Explained: Data Lake vs Warehouse vs Database
These postings are my own and do not necessarily represent BMC's position, strategies, or opinion.
See an error or have a suggestion? Please let us know by emailing blogs@bmc.com.