
Predicting point-of-sale (POS) sales across stores, coordinated with inventory and supply chain data, is table stakes for retailers. This blog explains this use case leveraging PySpark for data and machine learning (ML) pipelines on Databricks, orchestrated with Control-M to predict POS and forecast inventory items. This blog has two main parts. In the first section, we will cover the details of a retail forecasting use case and the ML pipeline defined in Azure Databricks. The second section will cover the integration between Control-M and Databricks.
Developing the use case in Azure Databricks
Note: All of the code used in this blog is available at this github repo.
In real life, data would be ingested from sensors and mobile devices, with near-real-time inventory measurements and POS data across stores. The data and ML pipeline is coordinated with Control-M to integrate the different components and visualize the results in an always-updated dashboard.
The data lands in the Databricks Intelligent Data Platform and is combined, enriched, and aggregated with PySpark Jobs. The resulting data is fed to different predictive algorithms for training and forecasting sales and demand with the results visualized in:
- Graphical dashboards
- Written as delta files to a data repository for offline consumption
In this post, we will also walk through the architecture and the components of this predictive system.
Data set and schema
The project uses real-world data, truncated in size and width to keep things simple. A simplified and abridged version of the schema is shown in Figure 1. The location table is a reference table, obtained from public datasets. The color coding of the fields shows the inter-table dependencies. Data was obtained partially from Kaggle and other public sources.
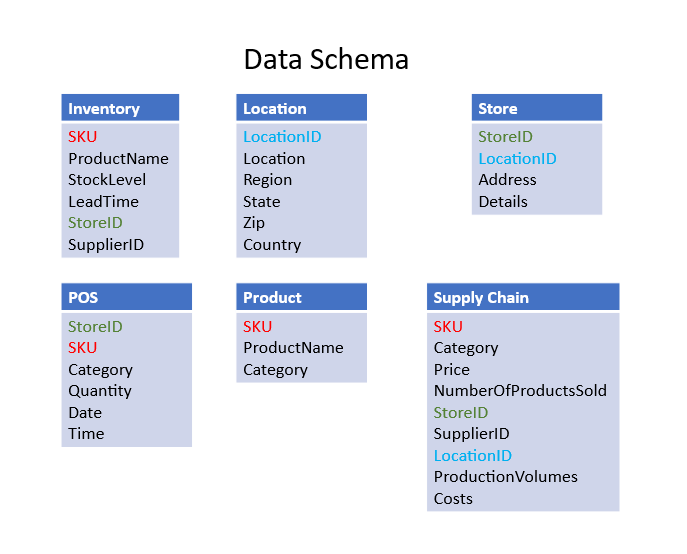
Figure 1. Example of schema.
Platform and components
The following components are used for implementing the use case:
- Databricks Intelligent Data Platform on Azure
- PySpark
- Python Pandas library
- Python Seaborn library for data visualization
- Jupyter Notebooks on Databricks
- Parquet and Delta file format
Project artifacts
- Working environment on Azure
- Code for data ingestion, processing, ML training, and serving and saving forecasted results to Databricks Lakehouse in delta format
- Code for workflow and orchestration with Control-M to coordinate all the activities and tasks and handle failure scenarios
High-level architecture and data flow
Current architecture assumes that data lands in the raw zone of the data lakehouse as a csv file with a pre-defined schema as a batch. The high-level overview of the data flow and associated processes is showed in Figure 2.
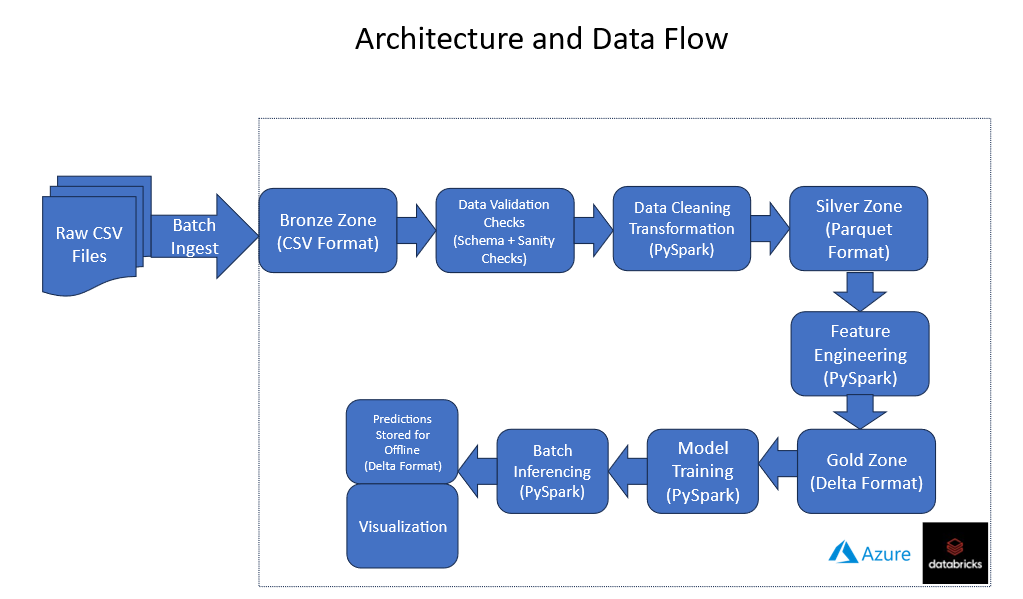
Figure 2. Overview of data flow and associated processes.
Data and feature engineering
Currently the data and ML pipelines are modeled as a batch process. Initial exploratory data analysis (EDA) was done to understand the datasets and relevant attributes contributing to predicting the inventory levels and POS sales. Initial EDA indicated that it is useful to transform the dates to “day of the week”- and “time of day”- type categories for best predictive results. The data pipelines included feature engineering capabilities for datasets that had time as part of the broader dataset.
Figure 3 shows a sample data pipeline for POS dataset. Figure 4 shows another similar data pipeline for an inventory dataset. Post data transformation, the transformed tables were joined to form a de-normalized table for model training. This is shown in Figure 5 for enriching the POS and the inventory data.
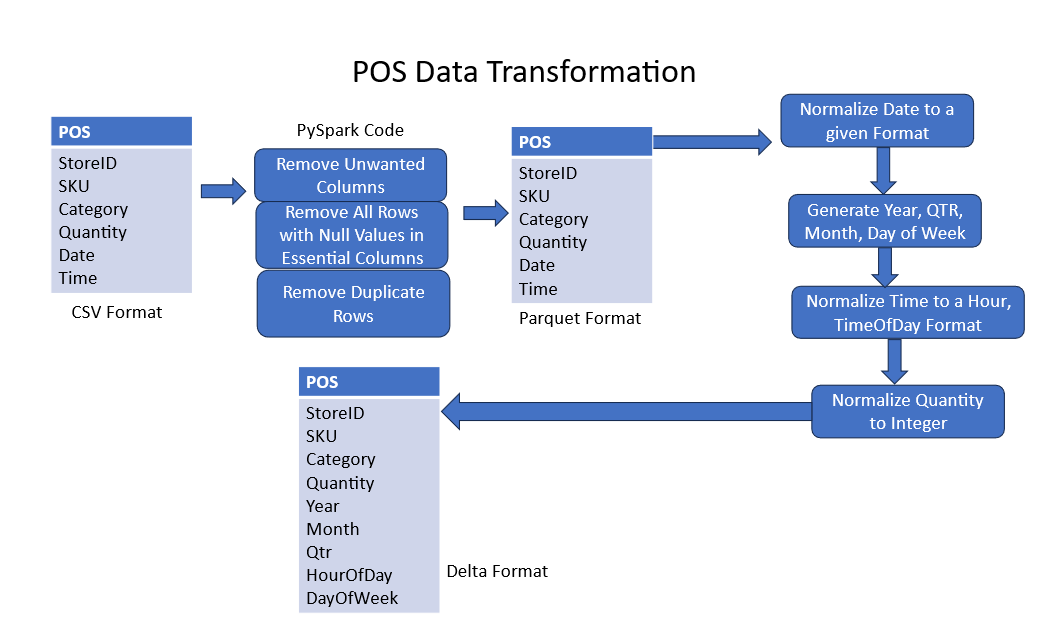
Figure 3. A sample data pipeline for POS dataset.
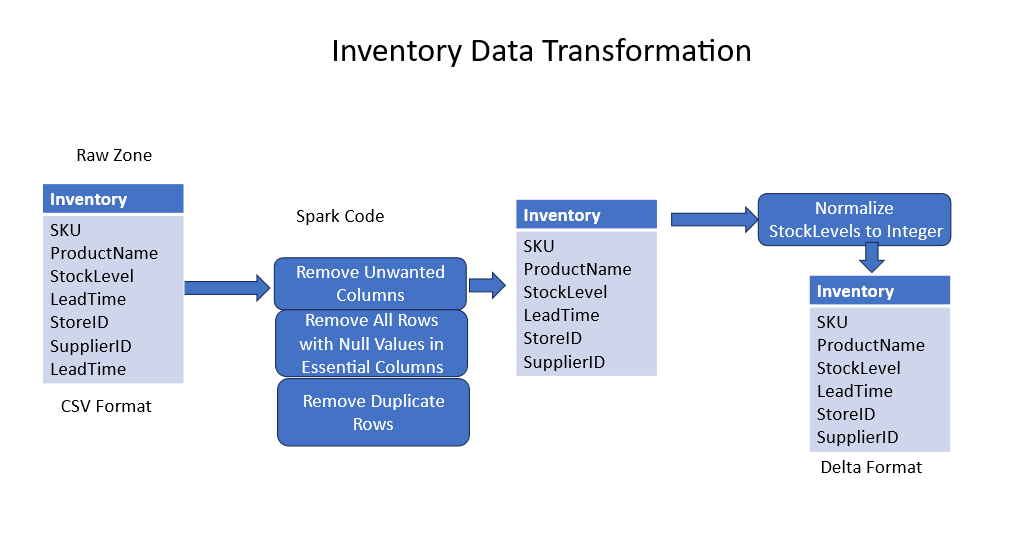
Figure 4. Sample data pipileine for inventory dataset.
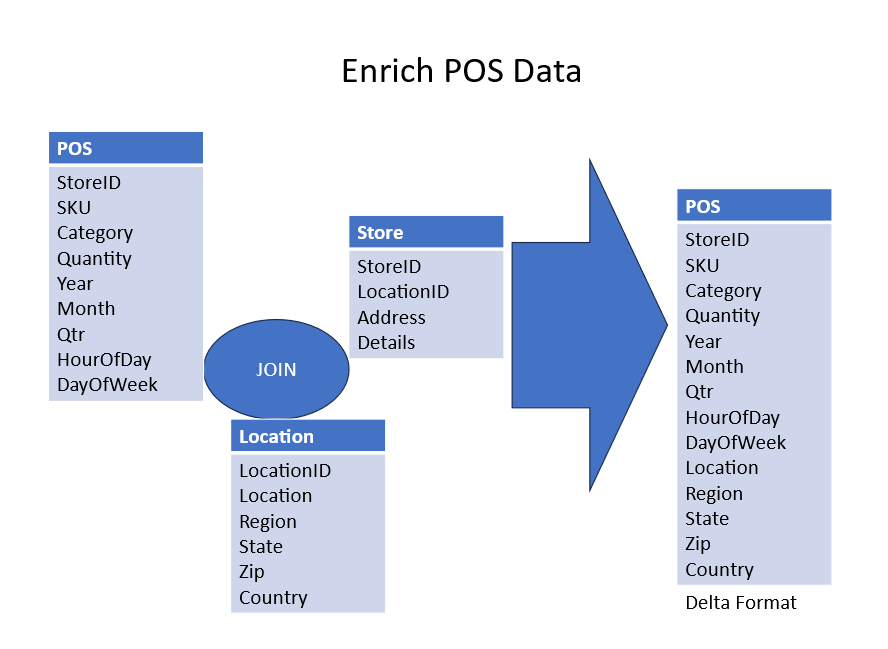
Figure 5. The joining of transformed tables to form a de-normalized table for model training.
Model training
The ML training pipeline used random forest and linear regression to predict the sales and inventory levels. The following modules from PySpark were used to create the ML pipeline and do one-hot encoding on the categorical variables.
- pyspark.ml.Pipeline
- pyspark.ml.feature.StringIndexer, OneHotEncoder
- pyspark.ml.feature.VectorAssembler
- pyspark.ml.feature.StandardScaler
- pyspark.ml.regression.RandomForestRegressor
- pyspark.ml.evaluation.RegressionEvaluator
- pyspark.ml.regression.LinearRegression
The enriched data was passed to the pipelines and the different regressor models were applied to the data to generate the predictions.
The RegressionEvaluator module was used to evaluate the results and the median absolute error (MAE), root mean squared error (RMSE), and R-squared metrics were generated to evaluate the predicted results. Feature weights were used to understand the contribution weights of each of the features to the predictions.
Orchestrating the end-to-end predictions
Data orchestration of the different PySpark notebooks uses a Databricks Workflows job while the production orchestration is performed by Control-M using its Databricks plug-in. This approach enables our Databricks workflow to be embedded into the larger supply chain and inventory business workflows already managed by Control-M for a fully automated, end-to-end orchestration of all related processing. Furthermore, it gives us access to advanced scheduling features like the ability to manage concurrent execution of multiple Databricks workflows that may require access to constrained shared resources such as public IP addresses in our Azure subscription.
Figure 6 shows the different orchestrated tasks to generate the offline predictions and dashboard. The orchestration was kept simple and does not show all the error paths and error handling paths.
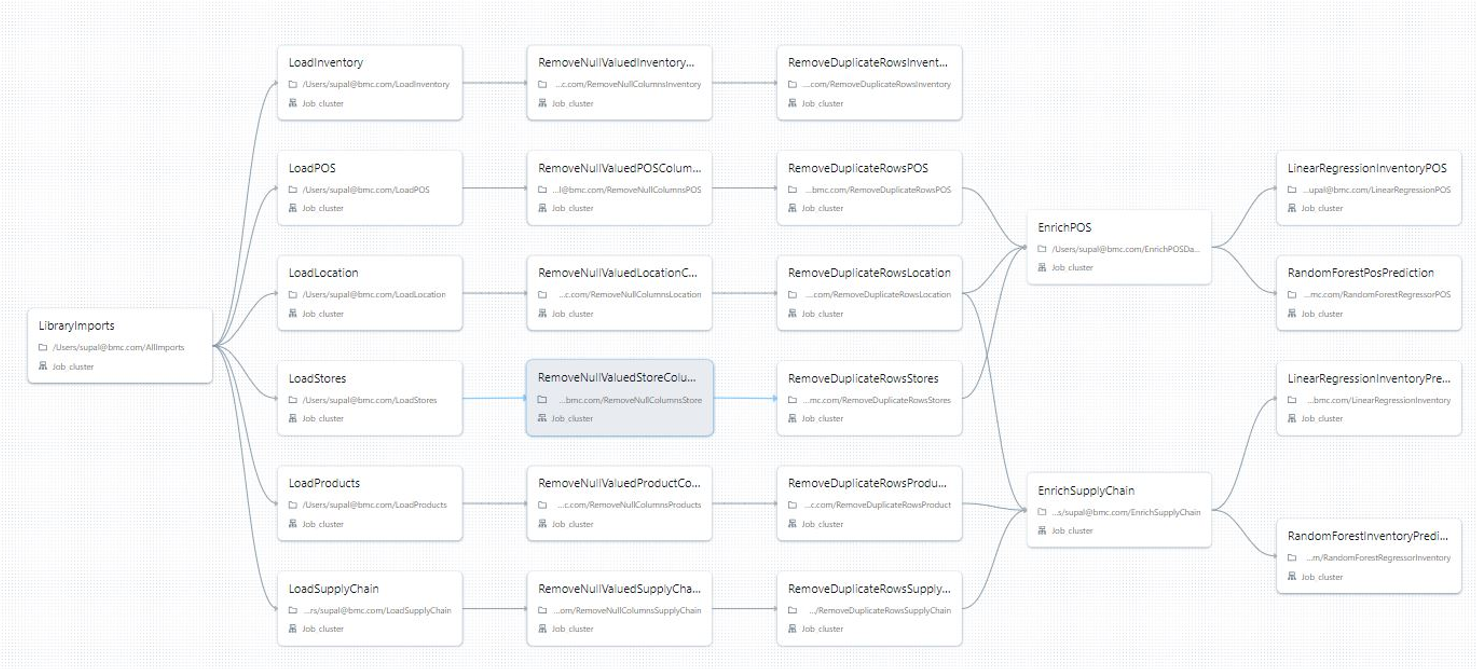
Figure 6. The different orchestrated tasks to generate the offline predictions and dashboard.
Control-M Integration with Databricks
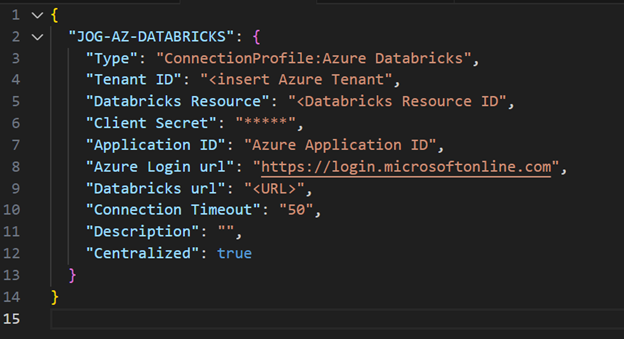
Before creating a job in Control-M that can execute the Databricks workflow, we will need to create a connection profile. A connection profile contains authorization credentials—such as the username, password, and other plug-in-specific parameters—and enables you to connect to the application server with only the connection profile name. Connection profiles can be created using the web interface and then retrieved in json format using Control-M’s Automation API. Included below is a sample of the connection profile for Azure Databricks in json format. If you create the connection profile directly in json before running the job, it should be deployed using the Control-M Automation API CLI.

Creating a Databricks job
The job in Control-M that will execute the Databricks workflow is defined in json format as follows:
{
"jog-databricks" : {
"Type" : "Folder",
"ControlmServer" : "smprod",
"OrderMethod" : "Manual",
"SiteStandard" : "jog",
"SubApplication" : "Databricks",
"CreatedBy" : "joe_goldberg@bmc.com",
"Application" : "jog",
"DaysKeepActiveIfNotOk" : "1",
"When" : {
"RuleBasedCalendars" : {
"Included" : [ "EVERYDAY" ],
"EVERYDAY" : {
"Type" : "Calendar:RuleBased",
"When" : {
"DaysRelation" : "OR",
"WeekDays" : [ "NONE" ],
"MonthDays" : [ "ALL" ]
}
}
}
},
"jog-azure-databricks-workflow" : {
"Type" : "Job:Azure Databricks",
"ConnectionProfile" : "JOG-AZ-DATABRICKS",
"Databricks Job ID" : "674653552173981",
"Parameters" : "\"params\" : {}",
"SubApplication" : "Databricks",
"Host" : "azureagents",
"CreatedBy" : "joe_goldberg@bmc.com",
"RunAs" : "JOG-AZ-DATABRICKS",
"Application" : "jog",
"When" : {
"WeekDays" : [ "NONE" ],
"MonthDays" : [ "ALL" ],
"DaysRelation" : "OR"
},
"AzEastPublicIPs" : {
"Type" : "Resource:Pool",
"Quantity" : "8"
}
}
}
}
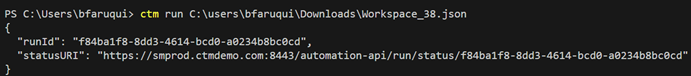
Running the Databricks workflow
To run the job we will use the run service within Automation API.
Visualizing the workflow
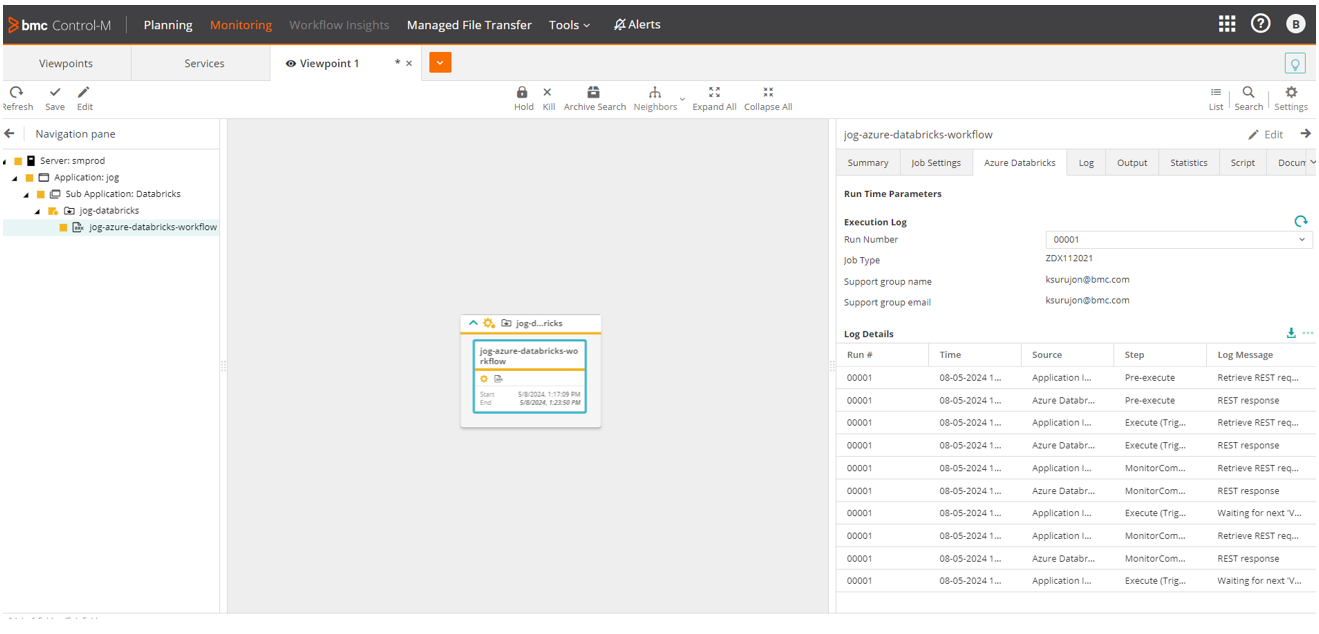
Figure 7. Databricks workflow executing in the Control-M monitoring domain.
Output of completed Databricks job in Control-M
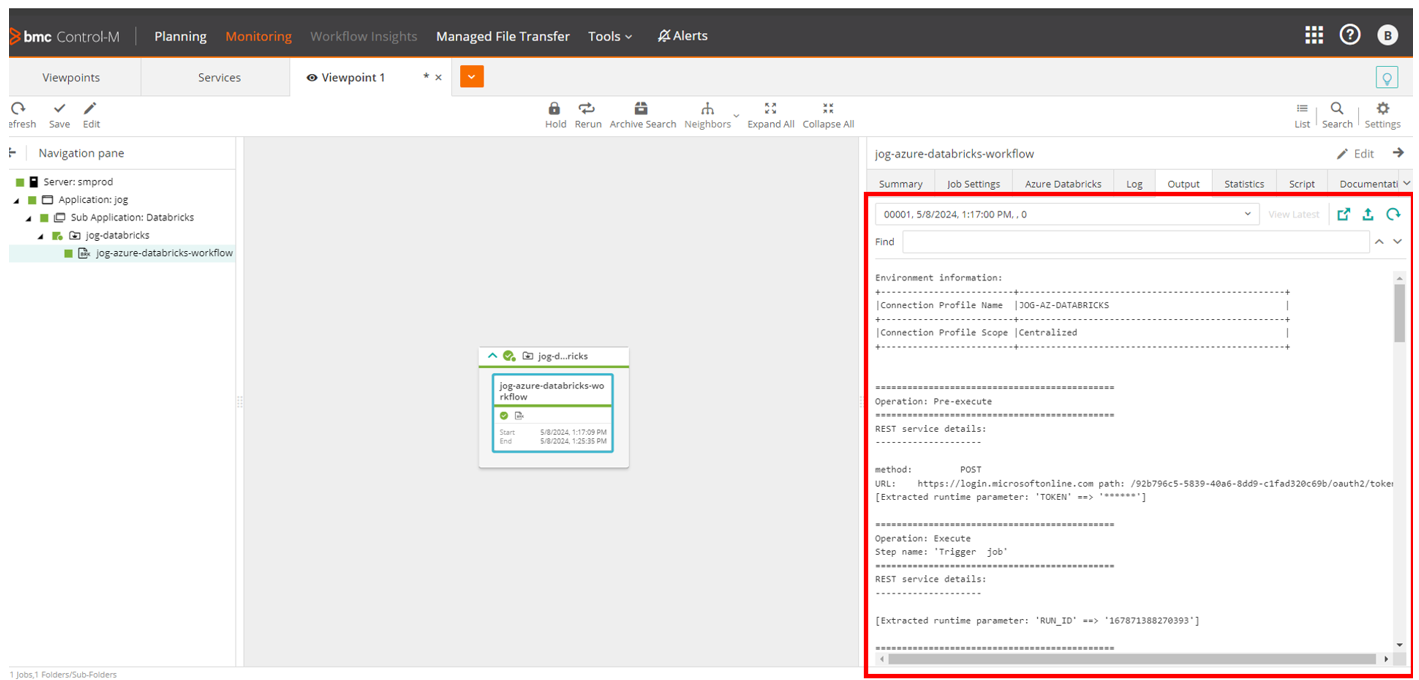
Figure 8. Output of completed Databricks job in Control-M.
Task workflow in Azure Databricks
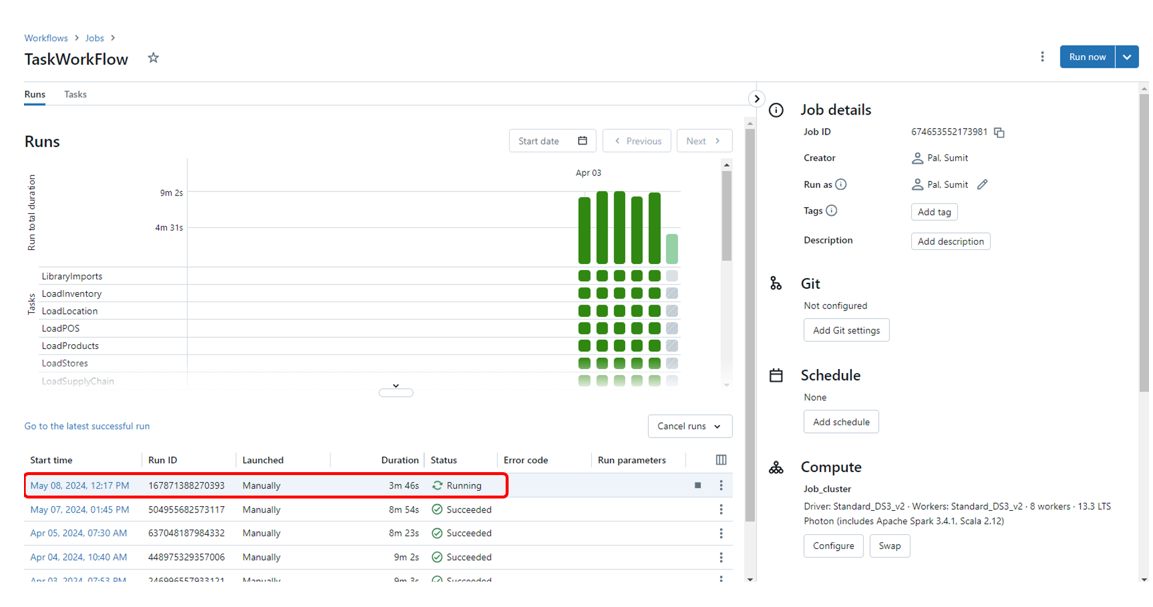
Figure 9. Task workflow in Azure Databricks.
Graph view of task workflow in Azure Databricks
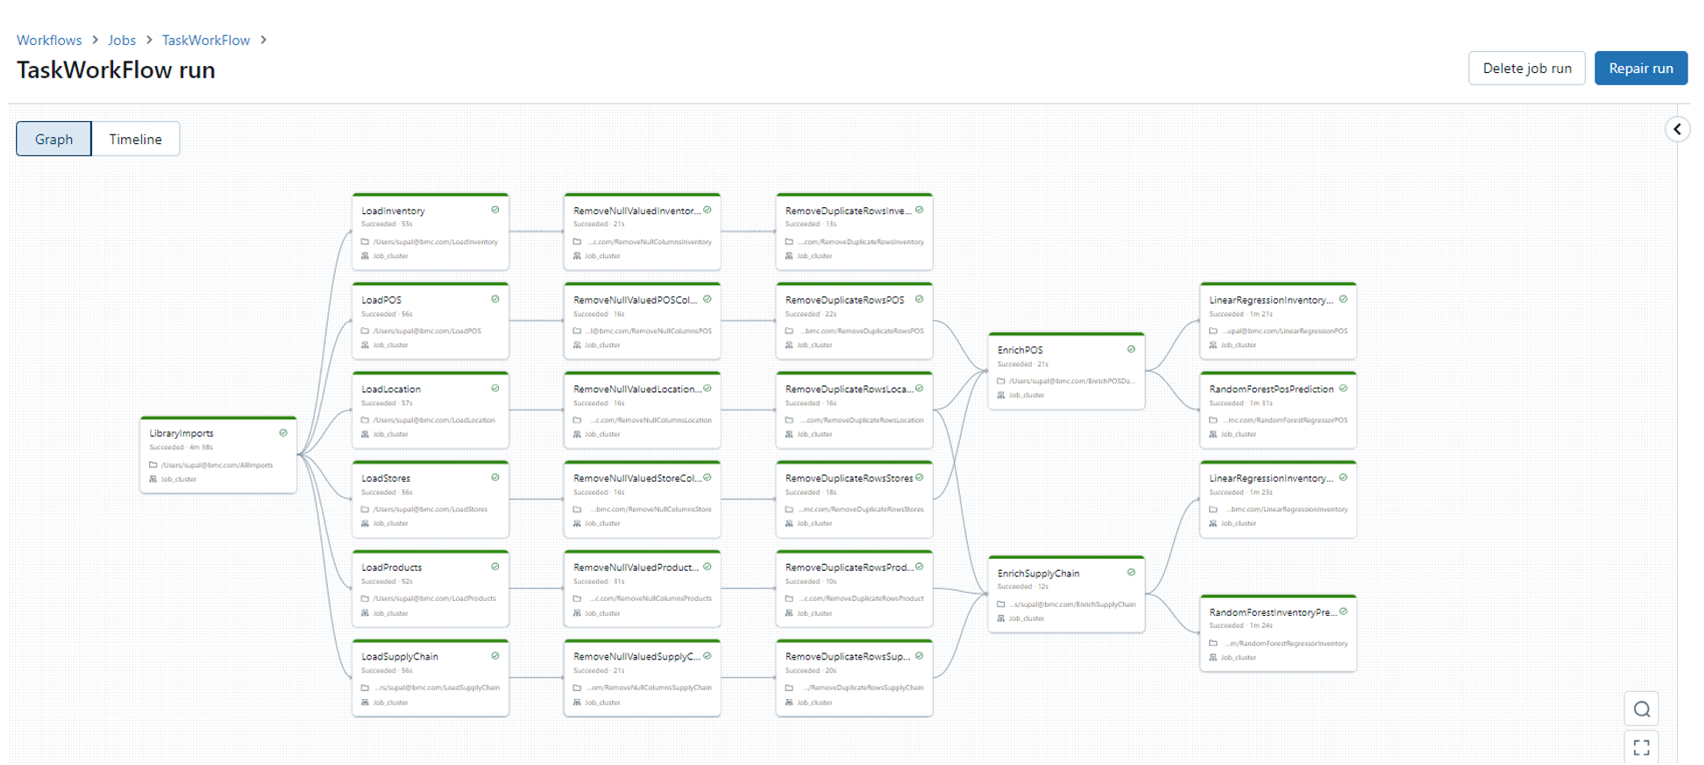
Figure 10. Graph view of task workflow in Azure Databricks.
Outputs and visualization
Two forms of output were generated during the project.
- Predicted results from the model for POS sales and inventory predictions needed based on demand—these were stored as Delta format files on the lakehouse for offline viewing and analysis.
- Visualizations of the feature weights that contributed to the predictions for POS and inventory data for both random forest and linear regression algorithms.
The four figures below show the feature weights for each of the above algorithms across the different features for POS and inventory predictions from the feature engineered attributes.
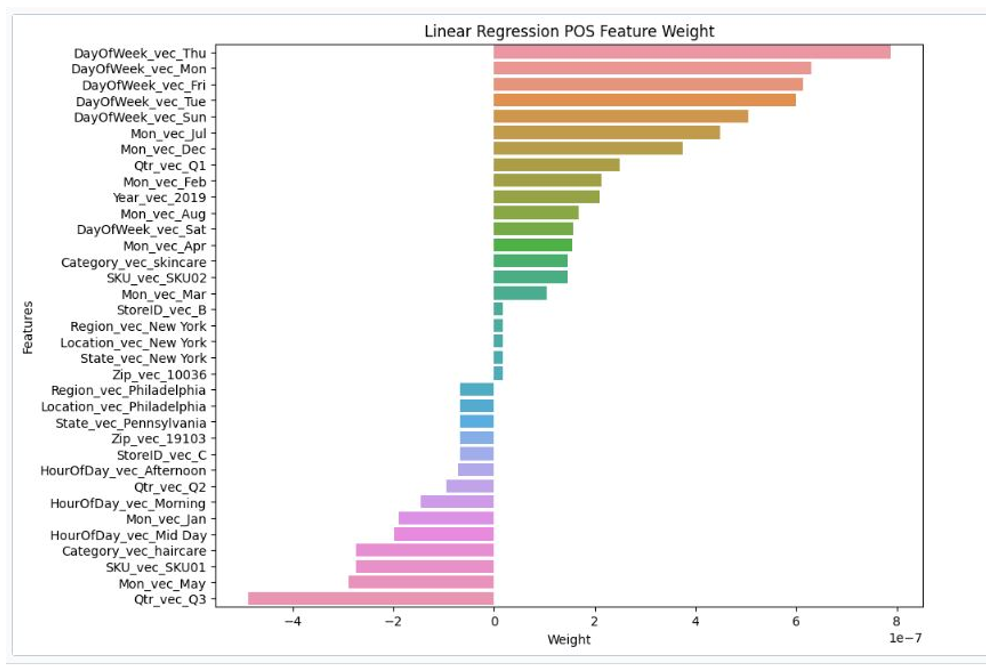
Figure 11. Linear regression POS feature weight.
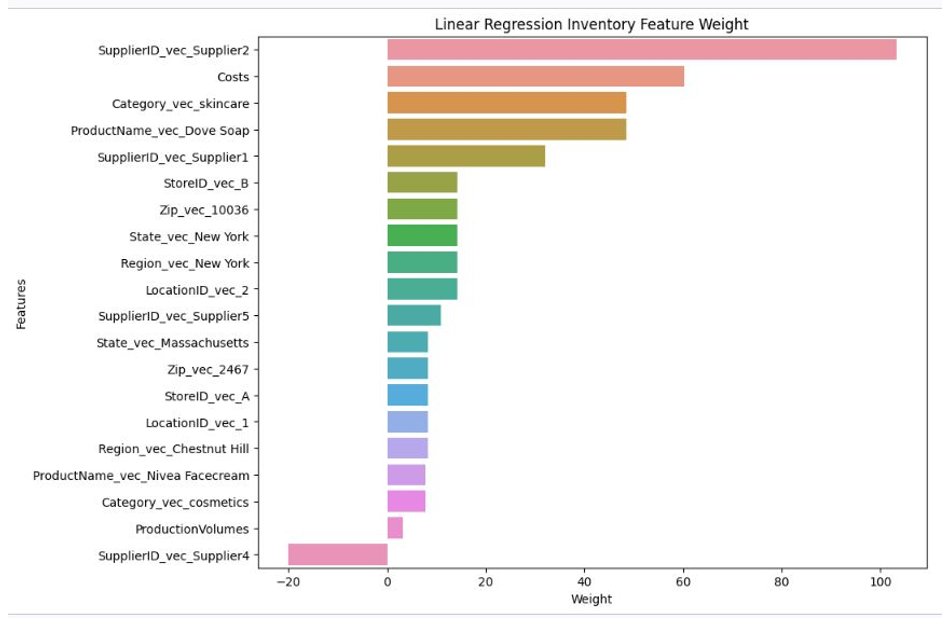
Figure 12. Linear regression inventory feature weight.
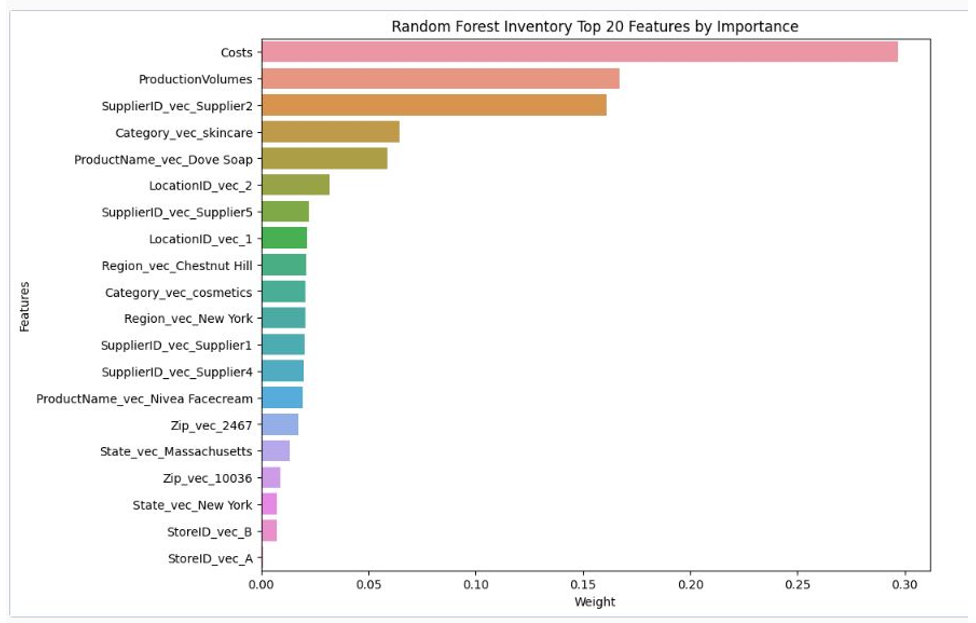
Figure 13. Random forest inventory top 20 features by importance.
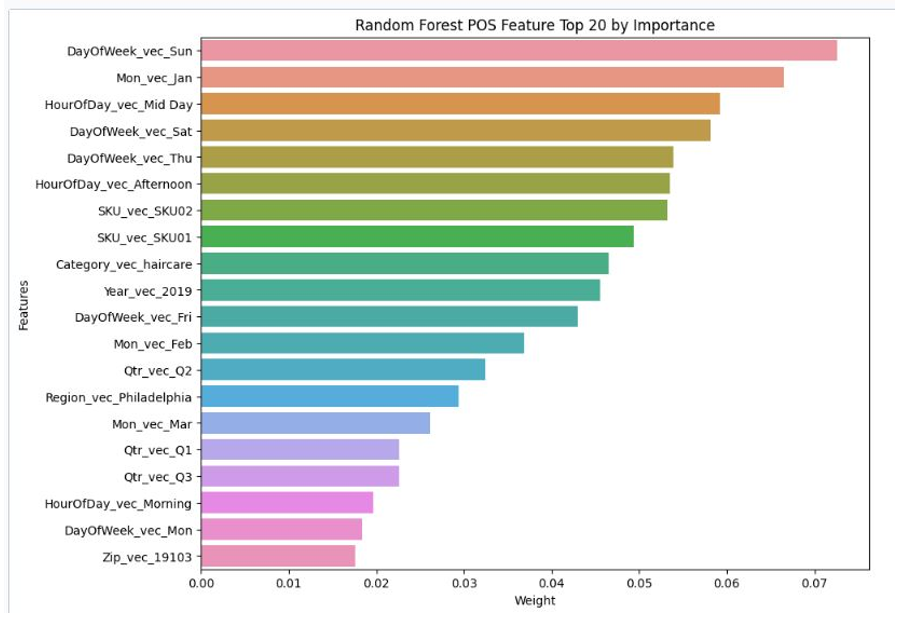
Figure 14. Random forest POS feature top 20 by importance.
Conclusion
This blog demonstrates an ML use case for forecasting of sales and inventory. The ML workflow is likely to be part of a larger orchestration workflow in Control-M. where it is interdependent on workflows running in POS and inventory management applications. However, in this blog, we have maintained the focus on the ML workflow in Databricks and its integration and execution through Control-M.
These postings are my own and do not necessarily represent BMC's position, strategies, or opinion.
See an error or have a suggestion? Please let us know by emailing blogs@bmc.com.