
In this article, we’ll show how to apply machine learning to cybersecurity. There are several use cases, but this article will focus on analyzing router logs.
(This tutorial is part of our Apache Spark Guide. Use the right-hand menu to navigate.)
Why use machine learning with cybersecurity
It’s almost impossible for an analyst looking at a time series chart of network traffic to draw any conclusion from what they are looking at. Why? People can’t see more than three dimensions. And, too many false alerts cause analysts to simply ignore some of what they’re seeing—too much noise.
But machine learning makes it possible to flush out, for example, criminal hackers who are stealing data from your system and transmitting it to their command and control center. This is what intrusion detection systems are supposed to do, but hackers use all kinds of techniques to avoid detection by traditional cybersecurity systems. For example, they could transmit stolen data in small pieces and send each to a different IP address, such as hijacked home computer users, then use those hijacked computers to send those pieces to their hacker command and control center.
In this example we’ll illustrate one approach to looking at network traffic. We use router logs provided by Verizon from the Bro-type router. We’ll group each record into one of seven clusters, then we’ll look at traffic in those clusters with the smaller number of entries. That, by definition, are our outliers.
K-means clustering
We use the k-mean clustering algorithm, which separates data along any number of axes. (For more, see k-means clustering with Apache Spark and Python Spark ML K-Means Examples or browse our Apache Spark guide using the right-hand menu.)
A data scientist would say that we are threading a hyperplane into n-dimensional space between the data points. Because we can’t visualize this, think of a 3D space, then thread a piece of paper between each set of data points such that points in one group are on one side of the paper and points in the other group are on the other.
This is an unsupervised model because there are no labels, only features. So, we don’t need to train the model, as there’s nothing to predict. Instead we are observing.
The code, explained
The code is available here, and the data here. This is data from a network analysis tool called Zeek, formerly called Bro.
The University of Cincinnati provides this description of the columns in this data:
- ts—time; timestamp
- uid—string; unique ID of connection
- orig_h—addr; originating endpoint’s IP address (aka ORIG)
- orig_p—port; originating endpoint’s TCP/UDP port or ICMP code
- resp_h—addr; responding endpoint’s IP address (aka RESP)
- resp_p—port; responding endpoint’s TCP/UDP port or ICMP code
- proto—transport_protoTransport layer protocol of connection
- service—string; dynamically detected application protocol, if any
- duration—interval; time of last packet seen to time of first packet seen
- orig_bytes—count; originator payload bytes, from sequence numbers if TCP
- resp_bytes—count; responder payload bytes, from sequence numbers if TCP
- conn_state—string; connection state (see conn.log:conn_state table)
- local_orig—bool; if conn originated locally T; if remotely F. If Site::local_nets empty, always unset
- missed_bytes—count; number of missing bytes in content gaps
- history—string; connection state history (see conn.log:history table)
- orig_pkts—count; number of ORIG packets
- orig_ip_bytes—count; number of ORIG IP bytes (via IP total_length header field)
- resp_pkts—count; number of RESP packets
- resp_ip_bytes—count; number of RESP IP bytes (via IP total_length header field)
- tunnel_parents—set; If tunneled, connection UID of encapsulating parent (s)
- orig_cc—string; ORIG GeoIP country dode
- resp_cc—string; RESP GeoIP country code
First, we load the csv file into a Spark dataframe.
from pyspark.sql.types import StructType, StructField, FloatType, BooleanType
from pyspark.sql.types import DoubleType, IntegerType, StringType
import pyspark
from pyspark.ml.linalg import Vectors
from pyspark.ml.feature import VectorAssembler
from pyspark.sql.functions import lit
from pyspark.sql.functions import udf, concat
from pyspark import SQLContext
conf = pyspark.SparkConf()
sc = pyspark.SparkContext.getOrCreate(conf=conf)
sqlcontext = SQLContext(sc)
schema = StructType([
StructField("ts", StringType(),True),
StructField("uid", StringType(),True),
StructField("origh", StringType(),True),
StructField("origp", StringType(),True),
StructField("resph", StringType(),True),
StructField("respp", StringType(),True),
StructField("proto", StringType(),True),
StructField("service" , StringType(),True),
StructField("duration", FloatType(),True),
StructField("origbytes", StringType(),True),
StructField("respbytes", StringType(),True),
StructField("connstate", StringType(),True),
StructField("localorig", StringType(),True),
StructField("missedbytes", StringType(),True),
StructField("history", StringType(),True),
StructField("origpkts", IntegerType(),True),
StructField("origipbytes", IntegerType(),True),
StructField("resppkts", IntegerType(),True),
StructField("respipbytes", IntegerType(),True),
StructField("tunnelparents", StringType(),True)
])
df = sqlcontext.read.csv(path="/home/ubuntu/Documents/forensics/bigger.log", sep="\t", schema=schema)
df2 = df.fillna(0)
Next, we register a UDF (user defined function). We will use this to turn all the fields sent to this function into integers because machine learning, for the most part, only works with numbers.
colsInt = udf(lambda z: toInt(z), IntegerType())
sqlcontext.udf.register("colsInt", colsInt)
def toInt(s):
if not s:
return 0
if isinstance(s, str) == True:
st = [str(ord(i)) for i in s]
return(int(''.join(st)))
else:
return s
Now, we create some additional columns which are the columns we have selected to feed into our model. For each of these, we will call the colsInt() UDF to convert those to numbers.
You could vary the choice of columns according to what hypotheses you want to follow. For example, below we look at the ports and traffic as well as the protocol.
- There might be other metrics in that log that we could add or remove.
- We should probably leave the destination IP address out of the model because of the hacker’s ability to hide their true destination.
- We might drop the UDP protocol since sftp (which is TCP) would be the protocol they would use to transmit that.
- Or, we could include the time of day in the local time zone to isolate after-hours events.
It all depends on what kind of activity you want to focus on.
Note that each of the .withColumn() statements create a new dataframe. This is because Spark dataframes are immutable.
a = df2.withColumn( 'iorigp',colsInt('origp'))
c = a.withColumn( 'irespp',colsInt('respp'))
d = c.withColumn( 'iproto',colsInt('proto'))
e = d.withColumn('iorigh',colsInt('origh'))
f = e.withColumn( 'iorigbytes',colsInt( 'origbytes'))
g = f.withColumn( 'irespbytes',colsInt('respbytes'))
h = g.withColumn(  'iorigpkts',colsInt( 'origpkts'))
i = h.withColumn( 'iorigipbytes',colsInt('origipbytes'))
columns =  ['iorigp','irespp','iproto', 'iorigbytes','irespbytes','iorigpkts','iorigipbytes']
The next step adds a column to our dataframe called features. This is a tuple of the columns we have selected. The K-means algorithm will expect there to be a features column.
vecAssembler = VectorAssembler(inputCols=columns, outputCol="features")
router = vecAssembler.transform(i)
Here, we use the K-means algorithm. One nice thing about Apache Spark is its machine learning algorithms are easy to use. They don’t require the reprocessing and reshaping that other frameworks do, and they work with Spark dataframes, so we could work with much larger sets of data. (Pandas does not scale like Spark dataframes do.)
from pyspark.ml.clustering import KMeans
from pyspark.ml.evaluation import ClusteringEvaluator
kmeans = KMeans().setK(7).setSeed(1)
model = kmeans.fit(router)
predictions = model.transform(router)
p = predictions.groupby('prediction').count()
q = p.toPandas()
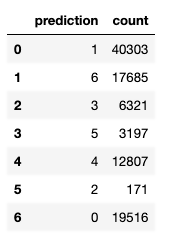
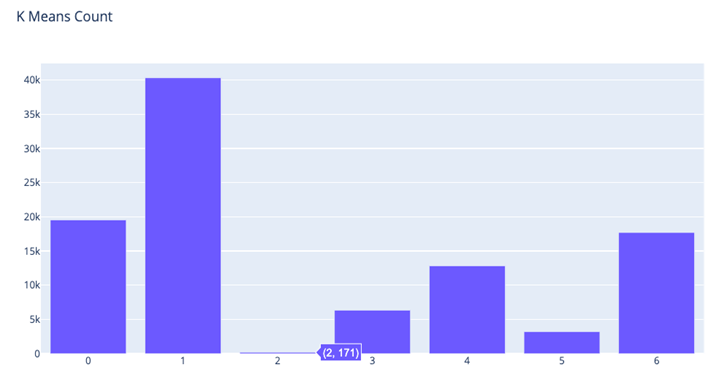
We have grouped the observations into 7 clusters. Cluster 0 has 40,303 router records, but cluster 2 has only 171. Clearly, those are outliers, so this is where we focus our cybersecurity analysis.
We can plot that as a bar chart to further show how the data is clustered.
from plotly.offline import plot
import pandas as pd
import plotly.graph_objects as go
fig = go.Figure(
data=[go.Bar(x=q['prediction'],y=q['count'])],
layout_title_text="K Means Count"
)
fig.show()
Plotly uses JavaScript to create popups to give you more information where you place the cursor. We’ve placed it at the point (prediction=2,count=121).
So, let’s make a new dataframe of just those records in cluster 2. (It’s actually row index 5 in the dataframe, so don’t confuse those two concepts.)
suspect = predictions.filter("prediction == 2")
Here we convert the output to Pandas, simply because the Jupyter notebook displays that data more clearly than it does dataframes, where it tends to chop off wide columns, making them hard to read.
x = suspect.select('ts','uid','origh','resph').toPandas()
You can see the same IP address shown more than a few times, which is probably a good place for further analysis. Look and see which machine it is and to whom it connects.
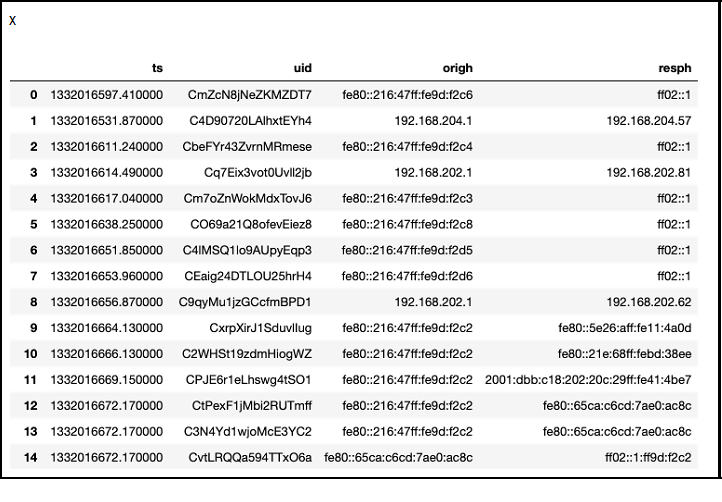 So, your analysts can look through logs in your applications, firewall, etc. to see what’s going on with those IP addresses. (Note that some of them are in IPv6 format.)
These postings are my own and do not necessarily represent BMC's position, strategies, or opinion.
See an error or have a suggestion? Please let us know by emailing blogs@bmc.com.