
BMC Helix IT Operations Management (ITOM) offers robust performance monitoring capabilities, enabling proactive issue identification and swift resolution. However, in instances where it’s inaccessible, BMC Helix on-premises applications expose metrics that can be leveraged by open-source monitoring and alerting solutions like Prometheus and Grafana.
Prometheus gathers detailed metrics about performance, application health, and infrastructure and allows user-defined, application-specific, custom metrics for more granular monitoring and insights. A versatile querying language (PromQL) enables users to slice and dice the collected data and apply sophisticated queries and visualizations for better decision making.
Prometheus integrates seamlessly with Grafana, which empowers users to visualize insights into their containerized deployments through rich dashboards and monitor and analyze the performance of containerized applications in real time. Since it’s open source, Prometheus does not incur licensing fees, making it a cost-effective solution for monitoring containerized deployments and on-premises, which is beneficial for customers with strict data governance and security requirements.
In this blog, I will explain how to set up and configure Prometheus and Grafana.
Data retrieval
Referring to the diagram here, the worker is responsible for collecting the metrics from the targets, so it will send the HTTP request out to specific targets and collect the metrics. Once it is collected, the metrics will be stored in a time-series database (TSDB), where we store all the metrics. The TSDB in Prometheus plays a crucial role in the efficient storage, retrieval, and management of time-series metrics.
The HTTP server allows us to retrieve the data stored in the database and has a built-in query language called PromQL. Exporters act as intermediaries between the target system and Prometheus, extracting metrics from the target system, transforming them into the Prometheus data format, and exposing an HTTP endpoint for the Prometheus Server to scrape them. We will be using a mixture of sidecar exporters and plugins.
Prometheus Operator
The Prometheus Operator is a custom controller that monitors the new object types introduced through the following custom resource definitions (CRDs).
- Prometheus: Defines the desired Prometheus deployments as a StatefulSet.
- Alertmanager: Defines a desired Alertmanager deployment.
- ServiceMonitor: Specifies how groups of Kubernetes services should be monitored.
- PodMonitor: Specifies how groups of pods should be monitored.
- Probe: Specifies how groups of ingresses or static targets should be monitored.
- PrometheusRule: Defines a desired set of Prometheus alerting and/or recording rules.
- AlertmanagerConfig: Specifies subsections of the Alertmanager configuration.
Kube-Prometheus
The Kube-Prometheus stack provides example configurations for a cluster monitoring stack based on Prometheus and the Prometheus Operator. It contains Kubernetes manifests for installing Grafana, Alertmanager, Node Exporter, and Kube-state-metrics, including all of the role-based access control (RBAC) permissions and service accounts needed to get it up and running, so instead of installing all of the components manually, you can simply use the Kube-Prometheus helm chart.
The stack is comprised of four components:
- Prometheus: Gets the metrics data from the application and stores it.
- Grafana: Takes data from Prometheus and displays in multiple visualizations.
- Alertmanager: Gets alerts from Prometheus and sends notifications.
- Push gateway: Adds support for metrics that cannot be scrapped.
For your reference, the individual manifests are located here. With the exception of the elastic-search and postgres exporter, the following objects will be deployed:
Node exporter: Runs as a pod on each node (daemonset) in the Kubernetes cluster and collects system-level metrics from the node, including CPU usage, memory usage, disk I/O statistics, and network statistics.
Elasticsearch/Postgres exporters: Used to collect and expose metrics in a format Prometheus can scrape.
Grafana: Query, visualize, and understand metrics from the Prometheus TSD.
Kube state metrics: Continuously watches the Kubernetes API server for changes to objects’ states and configurations. It retrieves information about these objects, including their current state, labels, annotations, and other relevant metadata.
Prometheus Operator: Introduces custom resource definitions (CRDs) for Prometheus, Alertmanager, service monitors, and other monitoring-related resources. These CRDs allow users to define monitoring configurations as Kubernetes objects.
Kube-Prometheus installation
Prerequisites
- Kubernetes 1.19 +
- Helm 3.12 +
- In order for the Prometheus Operator to work in an RBAC-based authorization environment, a ClusterRole with access to all the resources the Operator requires for the Kubernetes API needs to be created. A cluster admin is required to create this ClusterRole and a ClusterRoleBinding or RoleBinding to the ServiceAccount used by the Prometheus pods. The ServiceAccount used by the Prometheus pods can be specified in the Prometheus object.
Note: Prometheus does NOT modify any objects in the Kubernetes API, and only requires the get, list, and watch actions.
Steps
a) Add the Prometheus Community helm repository and update the repo.
helm repo add prometheus-community https://prometheus-community.github.io/helm-charts
helm repo update
b) Update helm version for compatibility.
wget https://get.helm.sh/helm-v3.12.3-linux-amd64.tar.gz
tar -zxvf helm-v3.12.3-linux-amd64.tar.gz
mv linux-amd64/helm /usr/local/bin/helm #(choose option to overwrite)
c) Install the Prometheus/Grafana stack with helm.
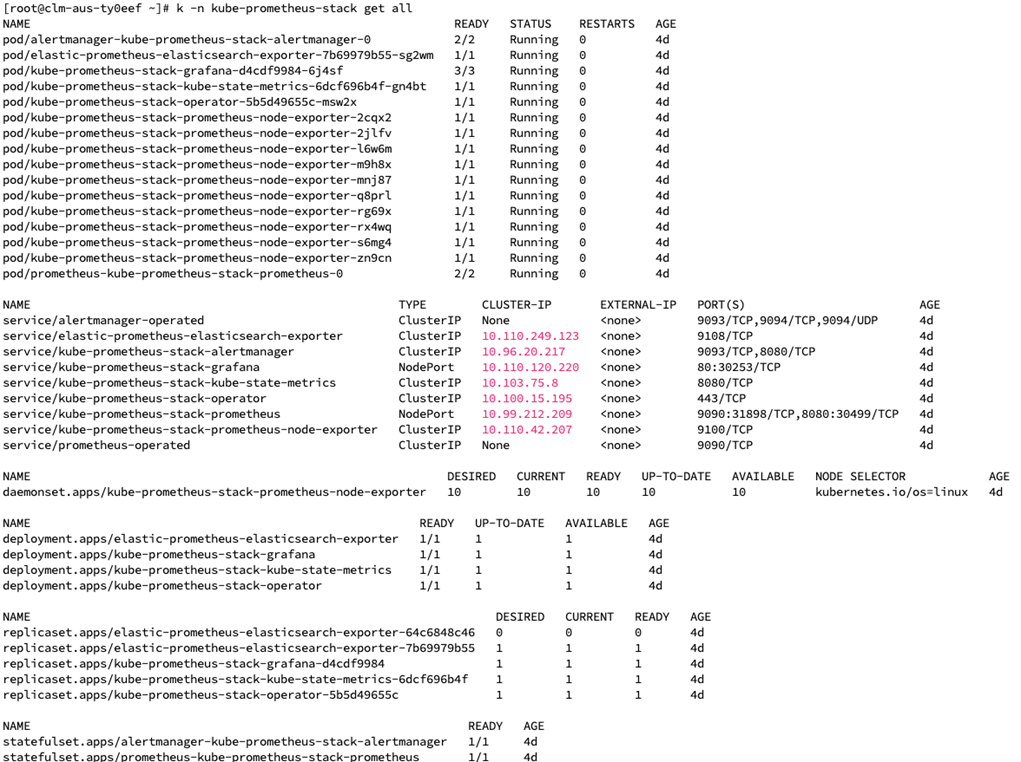
helm install kube-prometheus-stack --create-namespace --namespace kube-prometheus-stack prometheus-community/kube-prometheus-stack
d) Choose a service type, so long as it’s accessible from outside the cluster. For simplicity, we’ll use a NodePort service type as all nodes are available.
kubectl -n kube-prometheus-stack get svc kube-prometheus-stack-prometheus -o yaml > kube-prometheus-stack-prometheus.yaml #Backup service before edit
kubectl -n kube-prometheus-stack edit svc kube-prometheus-stack-prometheus #Dynamically update service
Search for type and change to NodePort (case sensitive), for example:
type: NodePort
Kubernetes will automatically pick an assign a port number, which will map to port 9090. For example:
kubectl -n kube-prometheus-stack get svc kube-prometheus-stack-prometheus
9090:30222/TCP,8080:30672/TCP 11d
e) Access Prometheus from any worker node on the port defined from above, for example:
http://worker3:30222
f) Change Grafana to a NodePort service.
kubectl -n kube-prometheus-stack get svc kube-prometheus-stack-grafana -o yaml > kube-prometheus-stack-grafana.yaml#Backup service before edit
kubectl -n kube-prometheus-stack edit svc kube-prometheus-stack-grafana #Dynamically update service
Search for type and change to NodePort (case sensitive), for example:
type: NodePort
As above, pick out the port K8s maps to port 80.
kubectl -n kube-prometheus-stack get svc kube-prometheus-stack-grafana
g) Access Grafana from any worker node on the port defined:
http://worker1:<serviceport>
The default username for this stack is admin and the password is prom-operator.
The Kube-Prometheus stack provides a number of out-of-the-box service monitors and reports that can be used for both BMC Helix Innovation Suite and BMC Helix platform Common Services.
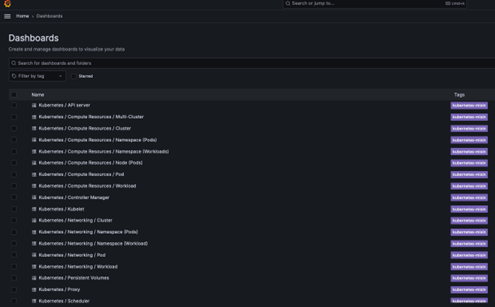
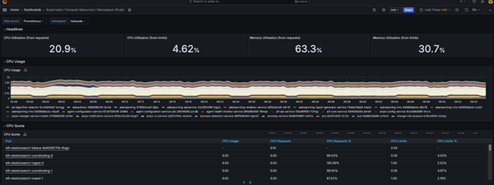
For example, to view data related to pods in a particular namespace, click on the Compute Resources /Namespaces Workloads report.
BMC Helix ServiceMonitors
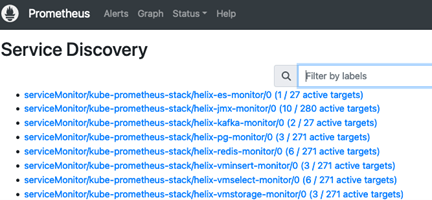
We provide the following Service Monitors for BMC Helix common services:
- helix-es-monitor
- helix-kafka-monitor
- helix-pg-monitor
- helix-redis-monitor
- helix-vminsert-monitor
- helix-vmselect-monitor
- helix-vmstorage-monitor
1. Download and copy the monitoring attachment from BMC Communities here.
2. Extract the file and change to the “monitoring” folder.
unzip monitoring.zip
cd monitoring
3. Install the BMC Helix-monitoring helm chart in the Kube-Prometheus-stack namespace against the Platform Common Services namespace (<platform>).
helm install helix-monitoring ./chart --set namespace=<platform> -n kube-prometheus-stack
4. BMC Helix ServiceMonitor objects and the namespace where they belong are selected by the serviceMonitorSelector and serviceMonitorNamespaceSelector of a Prometheus object, so we need to make sure the labels are consistent with the prometheuses.monitoring.core CRD.
kubectl -n kube-prometheus-stack get serviceMonitor | grep helix
helix-pg-monitor
helix-redis-monitor
helix-vmselect-monitor
helix-vmstorage-monitor
helix-vminsert-monitor
helix-es-monitor
helix-kafka-monitor
kubectl -n kube-prometheus-stack label servicemonitors --all release=kube-prometheus-stack # Label all service monitors so prometheus can find the correct service/pod
5. Install the elastic search exporter and create a Kubernetes secret with credentials.
helm -n kube-prometheus-stack install elastic prometheus-community/prometheus-elasticsearch-exporter
kubectl -n kube-prometheus-stack create secret generic elastic --from-literal=ES_USERNAME=admin --from-literal=ES_PASSWORD=admin
6. Mount the secret as an environmental variable and skip the SSL check.
kuebctl -n kube-prometheus-stack get deploy elastic-prometheus-elasticsearch-exporter -o yaml > elastic-prometheus-elasticsearch-exporter.yaml # Backup deployment before changing
kuebctl -n kube-prometheus-stack edit deploy elastic-prometheus-elasticsearch-exporter # Dynamically edit the deployment
spec:
containers:
- command:
- elasticsearch_exporter
- --log.format=logfmt
- --log.level=info
- --es.uri=https://opensearch-logs-data.<platform>:9200
- --es.ssl-skip-verify
- --es.all
- --es.indices
- --es.indices_settings
- --es.indices_mappings
- --es.shards
- --collector.snapshots
- --es.timeout=30s
- --web.listen-address=:9108
- --web.telemetry-path=/metrics
env:
- name: ES_PASSWORD
valueFrom:
secretKeyRef:
key: ES_PASSWORD
name: elastic
- name: ES_USERNAME
valueFrom:
secretKeyRef:
key: ES_USERNAME
name: elastic
Note:
- The indentation of the above yaml must be correct in order to commit the changes. There are various tools online to help, such as yamlchecker.
- Replace <platform> with the name of the Helix Platform Common Services namespace.
7. Update “matchLabels” with the label from the elastic exporter selector.
kubectl -n kube-prometheus-stack edit serviceMonitor helix-es-monitor
namespaceSelector:
matchNames:
- kube-prometheus-stack
selector:
matchLabels:
app: prometheus-elasticsearch-exporter
8. As of the current 24.2 Common Services release, we recommend using the standalone PostgreSQL exporter pod to obtain more comprehensive metrics.
helm -n kube-prometheus-stack install pgexporter prometheus-community/prometheus-postgres-exporter
9. Configure the exporter with an encrypted password (postgreSQL password from secrets.txt pre encryption).
a) echo -n pGTest2020 | base64 #output will be used for password
cEdUZXN0MjAyMA==
b) kubectl -n kube-prometheus-stack edit secret
apiVersion: v1
data:
data_source_password: cEdUZXN0MjAyMA==
kind: Secret
metadata:
annotations:
meta.helm.sh/release-name: pgexporter
10. Create a yaml file called pgpatch.yaml and paste in the following content:
spec:
template:
spec:
containers:
- name: prometheus-postgres-exporter
image: quay.io/prometheuscommunity/postgres-exporter:v0.15.0
env:
- name: DATA_SOURCE_URI
value: postgres-bmc-pg-ha.<platform>:5432/?sslmode=disable
11. Apply the patch.
kubectl -n kube-prometheus-stack patch deploy pgexporter-prometheus-postgres-exporter --type='strategic' -p "$(cat pgpatch.yaml)"
12. Update the Service Monitor to use the external exporter.
kubectl -n kube-prometheus-stack edit servicemonitor helix-pg-monitor
apiVersion: monitoring.coreos.com/v1
kind: ServiceMonitor
metadata:
annotations:
meta.helm.sh/release-name: helix-monitoring
meta.helm.sh/release-namespace: kube-prometheus-stack
creationTimestamp: "2024-03-29T14:16:32Z"
generation: 5
labels:
app: kube-prometheus-stack-prometheus
release: kube-prometheus-stack
name: helix-pg-monitor
namespace: kube-prometheus-stack
spec:
endpoints:
- interval: 30s
path: /metrics
scrapeTimeout: 20s
targetPort: 9187
namespaceSelector:
matchNames:
- kube-prometheus-stack
selector:
matchLabels:
app: prometheus-postgres-exporter
13. The Platform statefulset contain a Prometheus JMX agent which, is very useful to monitor JVM-related information. We can leverage this agent by simply copying an existing service monitor and updating it to use a new name against the label of the platform-fts pod. For example:
kubectl -n kube-prometheus-stack get serviceMonitor helix-redis-monitor -o yaml > helix-jmx-monitor.yaml #Copy an existing monitor and change as highlighted below
labels:
app: kube-prometheus-stack-prometheus
release: kube-prometheus-stack
name: helix-jmx-monitor
namespace: kube-prometheus-stack
resourceVersion: "44082249"
uid: 9d08c078-19dc-4fe1-b1b1-8e1bcb673e21
spec:
endpoints:
- interval: 30s
path: /metrics
scrapeTimeout: 20s
targetPort: 7070
namespaceSelector:
matchNames:
- <innovationsuite>
selector:
matchLabels:
app: platform-fts
kubectl -n kube-prometheus-stack apply -f helix-jmx-monitor.yaml #To deploy the service monitor
Note: Replace <innovationsuite> with the Innovation Suite namespace
14. At this stage you should now be able to view active Service Monitors by using the Status > Service Discovery menu.
15. To begin setting up reports, navigate to the Grafana > Dashboards tab and click on the “New” button to create a “Helix” folder.
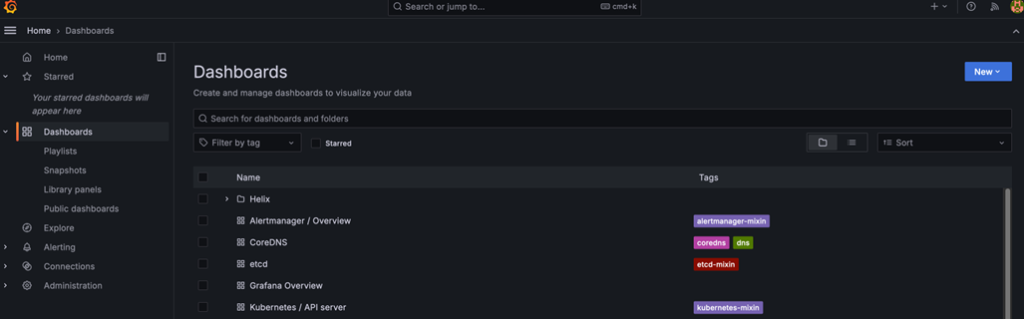
16. Now click New > Import.
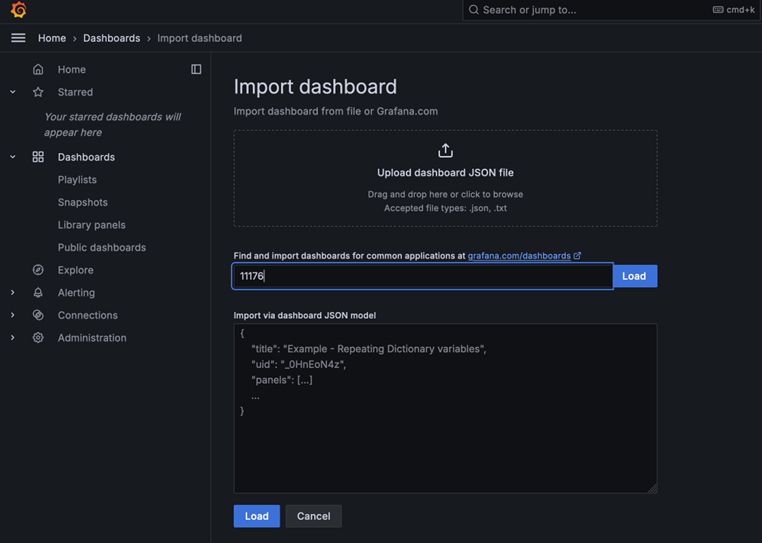
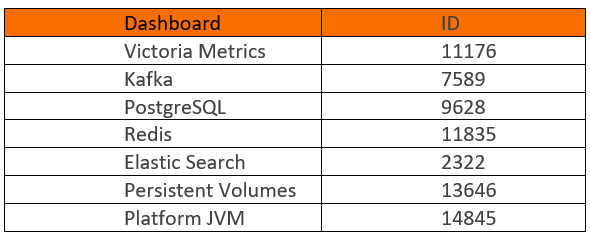
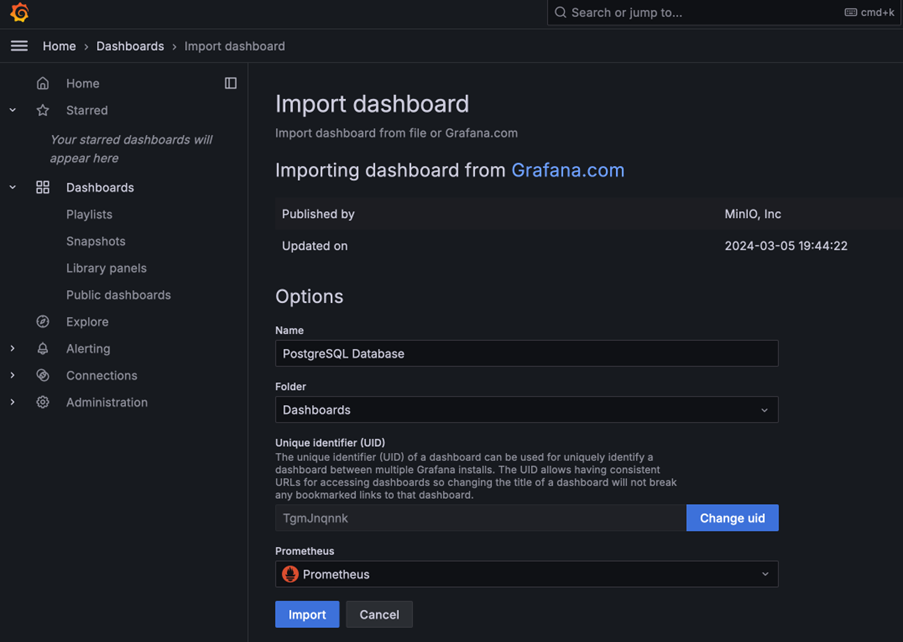
17. Enter the following dashboard ID numbers, click the load button and choose “Prometheus” as the data source followed by the import button.
For example, to set up PostgreSQL, choose”Prometheus” as the source.
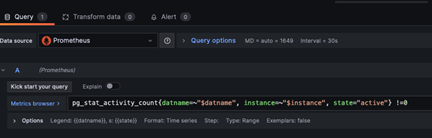
If you would like to see the promQL queries that these dashboards are using, simply click on the metric in the dashboard then choose edit from the menu. You are also free to add in your own queries.
In conclusion, BMC Helix IT Operations Management (ITOM) provides powerful performance monitoring capabilities. For scenarios where it’s inaccessible, the integration of open-source tools like Prometheus and Grafana offers a flexible alternative. These tools, with their robust metric gathering, querying, and visualization features, ensure that performance monitoring can continue seamlessly. The detailed architecture and installation steps outlined demonstrate how to leverage these tools effectively within a Kubernetes environment. Additionally, the use of the Prometheus Operator and the Kube-Prometheus stack simplifies the deployment and management of these monitoring tools, ensuring a comprehensive and scalable monitoring solution. While these open-source tools are not supported by BMC, they provide a valuable resource for maintaining system performance and reliability in diverse IT landscapes.
To learn more, visit our BMC Containerization Community Channel and check out the BMC documentation here.
These postings are my own and do not necessarily represent BMC's position, strategies, or opinion.
See an error or have a suggestion? Please let us know by emailing blogs@bmc.com.