
This is the third installment in our series on Tableau. Here, I’ll explain how to use Tableau to do an expense report. We will illustrate basic Tableau concepts, such as writing formulas.
Our previous articles on Tableau include:
(This article is part of our Tableau Online Guide. Use the right-hand menu to navigate.)
Setting up Tableau with your data
We recommend using Tableau Online instead of the desktop version. (It costs $70 per user per month, with a free 14-day trial.) Salesforce acquired Tableau, so its future is in the cloud product. This means you can work from any place, without needing the desktop software.
For the data, use a credit card or bank statement or anything with categories, so that you can list expenses by category. We are using a credit card statement.
We loaded our data into PostgreSQL, as explained here. You can use PostgreSQL with a .cvs or .xls file, but you cannot do aggregations, so it’s not very useful. Therefore, load your data into PostgreSQL first. You could also use Apache Hive or any other the other data sources that Tableau supports.
Creating a bar chart
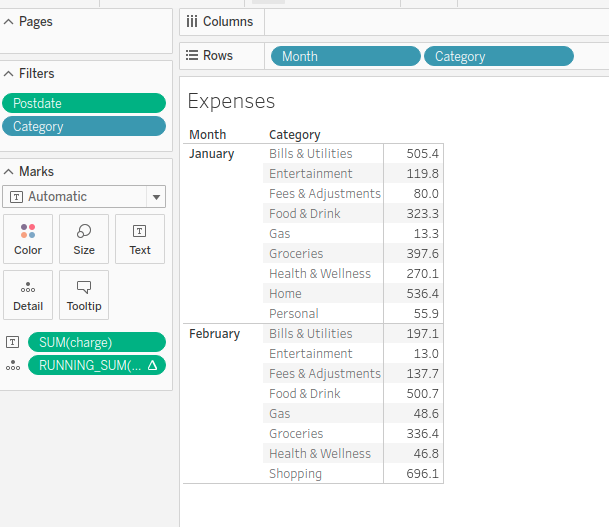
Here is a finished expense report for the months of January and February. If you want a graphical report, like this bar chart, then listing one month next to another is one option.
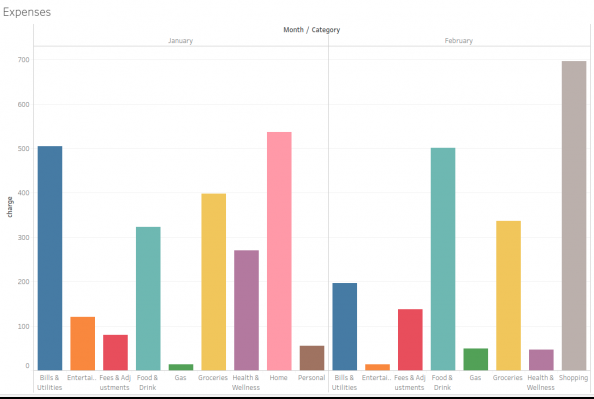
Another option is to make a stacked bar chart, or a spreadsheet-like chart, which is what we do below. (The screen will get too crowded to list a whole year in a bar chart format. We will explain how to solve that problem in future blog posts.)
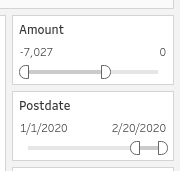
Credit card payments are negative numbers. So, add a filter on the amount column to filter out your payments. (They are > 0.) Then, add a filter on the transaction postdate to limit it to two months. Otherwise you would have 12 charts drawn across the screen, which is too wide to read.
Further down we explain how to make filters and basic charts (You can refer to the previous articles for more details.)
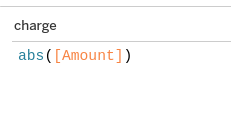
We want to show negative numbers as positive for clarity. Use the ABS (absolute value) function. To do this, click on the amount field then select create calculated field.
Type in some suitable name at the top then write the formula below that:
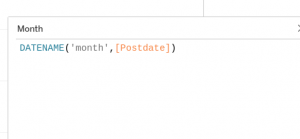
To extract the month from the Postdate, write this calculated field:
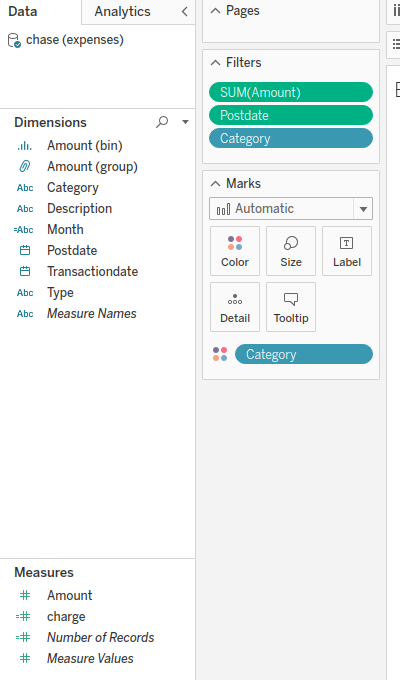
This is what the screen will look like to make this report. The filters are at the top. Far to the right (shown above) is where you enter the filter ranges. Fields in the table located on the far left. To use them, simply drag them onto the worksheet, filter, or row and column areas or click add to worksheet.
Creating a worksheet
Now we switch to a worksheet-type display, as opposed to a chart. To switch to that display or other chart types, click the show me icon at the top right of the display.
A worksheet lets us plot more than two dimensions. (If you tried to make a chart out of this it would make an additional chart of every dimension greater than two, at least for the bar chart). Of course, you could try a 3-dimensional chart, but those are hard for users to understand.
Notice that we have Month and Category as Rows and no fields as columns. Then in the Marks section we have sum(charge). (Ignore Running Sum, as we are not using that.)
By default, Tableau will assume that we want a report of expenses by month (first) and category (second) since we listed month on the left and category on the right. It adds the function sum() to the amount since it assumes we want to aggregate that.
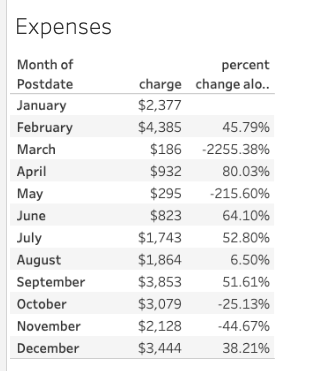
Calculating percent change
Now let’s calculate the percent change in expenses per month. (We drop the category as percent change by category by month is harder to do.)
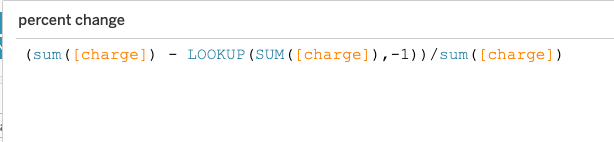
The formula for percent change is:
| (new value – old value) / old value |
In terms of the data we have, that is the formula shown below. It’s not very sophisticated as the LOOKUP function is just a table function which means look up to the cell one row (-1) above the current row. In other words it’s applied to the displayed worksheet and not the underlying data.
| (sum([charge]) – LOOKUP(SUM([charge]),-1))/sum([charge]) |
By default, Tableau will round off these numbers to integers, so most will be 0 or 1. So click on the value in the Marks panel and then click format to change it to a percent in order to see decimal points.
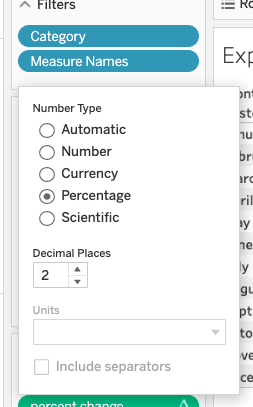
Here is the result:
These postings are my own and do not necessarily represent BMC's position, strategies, or opinion.
See an error or have a suggestion? Please let us know by emailing blogs@bmc.com.