The concept of continuous improvement is central to DevOps, challenging organizations to constantly strive to utilize the best practices and tools available to satisfy and delight customers who demand high-quality, innovative solutions delivered at the speed of “now.” To maintain a continuous pace of improvement, though, organizations must know where they stand at each step of the DevOps journey, continuously measuring themselves and making data-based decisions on where to go next.
BMC AMI zAdviser provides this insight, continuously collecting data and applying machine learning to generate key performance indicators (KPIs) that give development organizations the data-driven insights required to measure their own progress and improve the quality, velocity, and efficiency of their software development and delivery.
Our January 2022 release includes six new KPI dashboards within BMC AMI zAdviser that:
- Provide visibility into the progress of an organization’s DevOps transformation
- Pinpoint trends causing software delivery bottlenecks and quality issues
- Offer actionable insights that fuel the organization’s continuous improvement
The new dashboards provide insight in the following areas:
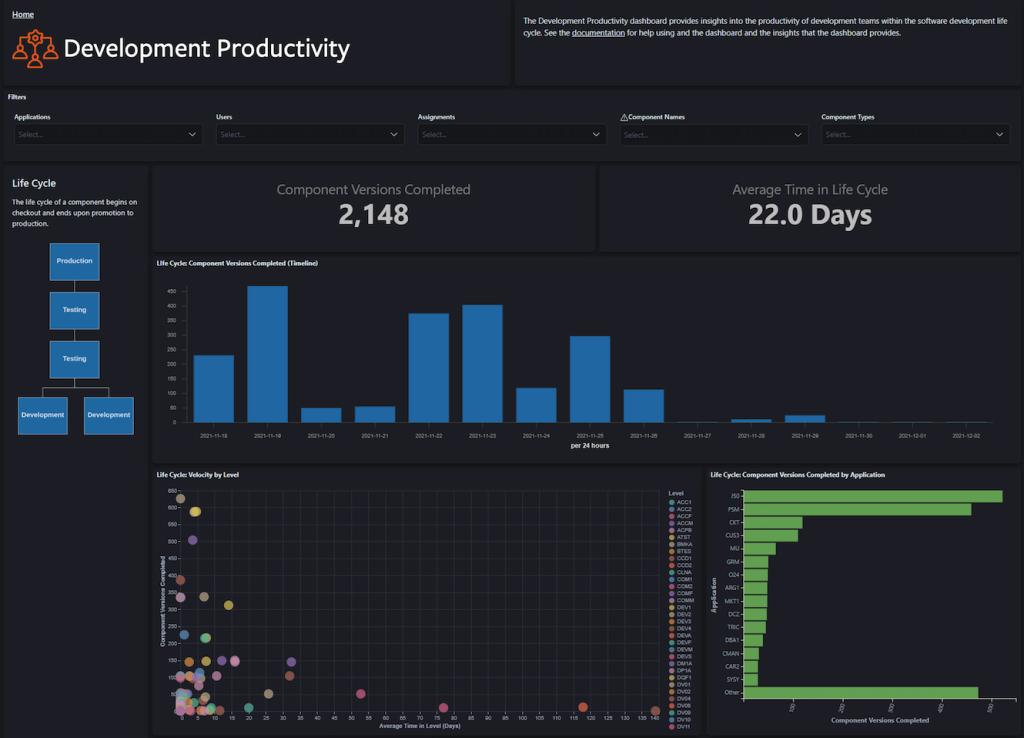
Development Productivity
This BMC AMI DevX Code Pipeline dashboard measures how long it takes to move code through the software delivery lifecycle (SDLC) from the developer checking out the code to promotion to production.

Automated Testing
Automated testing solutions not only help bring new products and services to market faster, they improve overall code quality—but only if they are being utilized. The BMC AMI DevX Total Test dashboard promotes the adoption of agile mainframe DevOps, giving managers insight into how many developers are utilizing automated testing, how many tests are executed on a daily basis, and whether or not those tests are passing or failing.
The Quality dashboard promotes application quality by tracking the percentage of bugs escaping into production through the Escaped Abend Ratio.
DevOps Adoption
Another way to track DevOps adoption, this dashboard shows how many developers have adopted use of BMC AMI DevX Workbench for Eclipse’s modern integrated development environment (IDE) and how many are still developing using the ISPF “green screen.”
System Automation Visibility
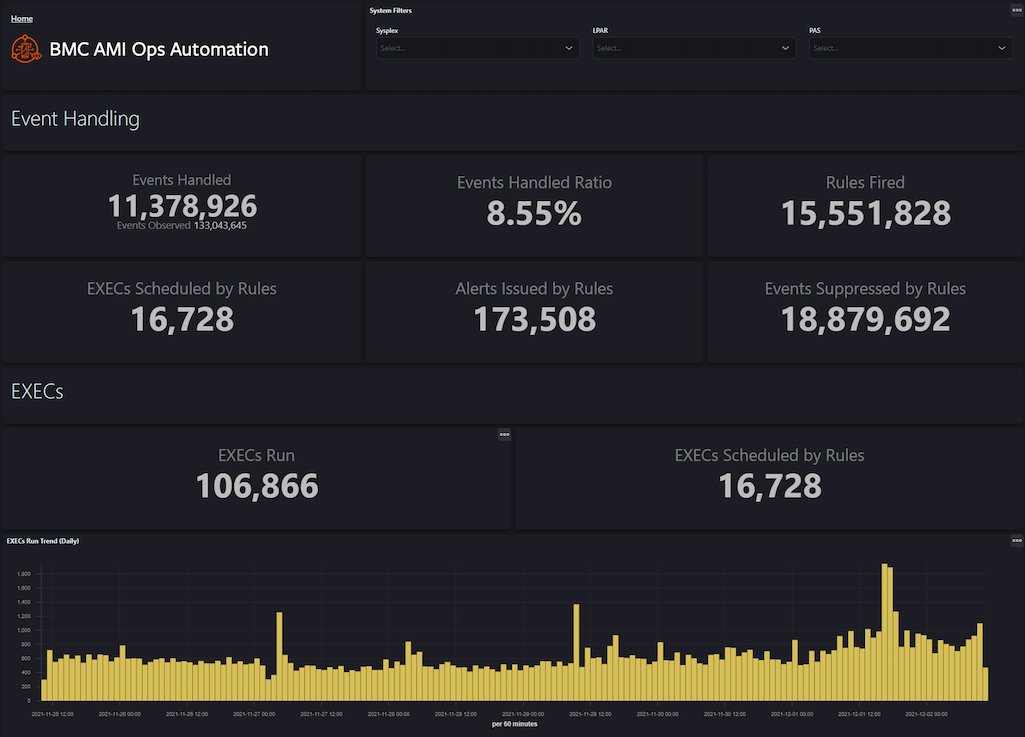
The BMC AMI Ops Automation dashboard provides IT Operations managers with visibility into the performance and efficiency of their automated processes. It displays the total number of mainframe events and how the events were handled by BMC AMI Ops automation. Some of the key metrics include:
- Visibility into number of rules vs EXECs that were run
- How many alerts were generated
Events are also broken out by event type to provide a better understanding of what is driving automation. The dashboard can be filtered by time as well as by LPAR and BMC AMI Ops instance to get a more detailed understanding of automation behavior.

Message Queue Visibility
The BMC AMI Message Advisor for IMS™ dashboard makes it easy to identify trends in IMS message queues and avoid queue error conditions and overflows. The dashboard shows overall BMC AMI Message Advisor for IMS events with the ability to drill in on Queue Protection Facility (QPF) actions where the product automatically responded to prevent an IMS outage.
Users also get visibility into message requeue actions with the ability to know how many happened, how many messages were successfully requeued, and how many were skipped.
New zAdviser dashboards advance DevOps
With enhanced visibility into the productivity of development teams, the quality of mainframe code, IMS message queues trends, and the overall adoption rates and performance of modern tooling and automation, these new zAdviser dashboards help organizations advance their DevOps initiatives with actionable insights. We can’t think of a better way to ensure continuous improvement than by continuously improving DevOps tools and processes.


