Modern enterprise IT environments comprise complex system architecture. IT workloads, apps, and hardware system components interact and depend on each other to deliver the necessary functionality. The infrastructure and apps evolve as more lines of code are added to the codebase that scales IT apps and services to a growing user base, running on software-defined, virtualized, or cloud-based IT environments.
What is ADDM?
To ensure that apps perform optimally, it’s important to discover and map the underlying dependencies. The technology that enables this capability is called Application Discovery and Dependency Mapping (ADDM). ADDM solutions are:
A management solution that discovers the relationships of app components and the underlying components and maps them to deliver a comprehensive insight into the resources running in the IT infrastructure and their dependencies.
How ADDM works
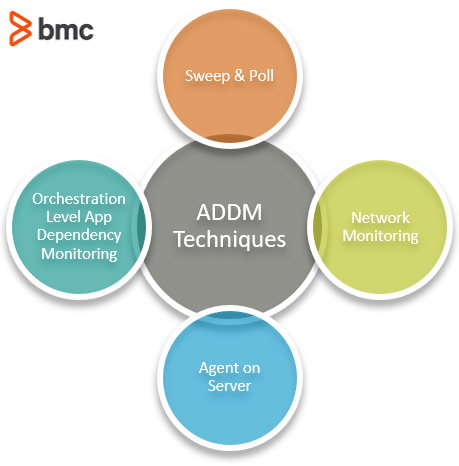
Application dependency mapping can be implemented in several ways, ranging from brainstorming and manual element polling to automated discovery of the entire IT ecosystem. The techniques can be agent-based or agentless monitoring, as described below:

(See how IT discovery works.)
Sweep and Poll
The agentless monitoring technique is the traditional way of discovering IT assets: by pinging IP addresses and identifying the responding devices. The technique identifies app components, devices, and server systems based on information such as discovery ping rate and device group information, established based on known device data.
The sweep and poll method is lightweight and allows users to sweep the entire network from a single connected node location.
The process may be slow for large-scale data centers, which is a drawback considering that dependencies can change during the process and leave critical assets undiscovered. Furthermore, discovering app components, particularly in dynamic virtualized and cloud-based IT environments with limited visibility and control, may be particularly challenging.
Network Monitoring
Network monitoring looks at real-time packet information and captures accurate data on application dependencies. The Netflow protocol contains IP traffic information such as:
- Volume
- Path
- Source and destination nodes
- Other IP flow attributes
Using protocols such as Netflow for traffic monitoring has its disadvantages. Netflow implementation can impact the performance of devices given its large bandwidth requirements. To address this issue, the data is sampled at intervals, which reduces the demand for bandwidth consumption but also collects fewer packet information since the unsampled data is not monitored.
Additionally, Netflow containing IP address and TCP port data cannot differentiate application-level dependencies. As an alternative, data packets can be captured but still provide only limited information collected at the time of probing.
Agent on Server
With agent-based monitoring, a software component is installed on the client server and is used to collect data. A monitoring station at the server side requests the data at periodic intervals based on a predefined policy. The agent monitors incoming and outgoing traffic in real-time and can identify the topology changes in application dependency as they happen.
This capability is particularly suitable for the dynamic virtualized infrastructure environments. Additionally, they can differentiate between apps running on the same server instances and the overall cost of running agents is less than using individual hardware devices to collect packet data.
However, agents must be installed on every server to ensure complete visibility. This can ultimately cause the monitoring agents to consume too much of the computing resources, impacting the server infrastructure’s:
- Overall cost
- Operating performance
Orchestration Level Application Dependency Mapping
Automation and orchestration platforms are becoming increasingly popular to manage IT environments. This enables IT to provision resources for specific IT workloads efficiently using advanced software solutions. These solutions combine multiple automated tasks and configurations across app components that must utilize the necessary IT resources. In doing so, the orchestration technologies also keep track of the app components and the underlying server resources.
Together with Application Performance Monitoring (APM), AIOps, and other agentless or agent-based technologies, a hybrid discovery and dependency mapping can enable accurate reporting while maintaining optimal cost and performance of the monitoring systems.
Even with the right application monitoring information available, organizations must be prepared to proactively manage risks and prevent performance bottlenecks. Three key aspects should be considered in devising a playbook guideline to achieve these goals:
- Apps and Systems. Obtain comprehensive information about the apps and systems that can be potentially impacted. Continuously update existing dependency mapping documentation as new features, app components, and infrastructure resources are deployed.
- Risks and Mitigation. Evaluate and prioritize the risks involved. Analyze vulnerabilities from a security, performance, and cost perspective. Provide specific guidelines and identify roles and responsibilities among team members as part of an effective risk mitigation plan.
- Feedback and Iterate. The IT environment is constantly evolving as new software components are installed and new, scalable infrastructure resources are provisioned. As organizations shift workloads from legacy on-premise systems to advanced cloud-based infrastructure, the IT environment becomes more complex and dynamic. It is therefore important to follow up with team members, improve the knowledge base, and invest in the right technology resources and practices for app discovery and dependency mapping.
Additional resources
For related reading, explore these resources:
- BMC Service Management Blog
- BMC AIOps Blog
- Application Mapping for Multi-Cloud Environments: Start Here, Start There, Start Anywhere
- How Workflow Orchestration Improves Application Development and Monitoring
- Get Started with ITAM: IT Asset Management Explained
These postings are my own and do not necessarily represent BMC's position, strategies, or opinion.
See an error or have a suggestion? Please let us know by emailing blogs@bmc.com.


