
Zeppelin is an interactive notebook. It lets you write code into a web page, execute it, and display the results in a table or graph. It also does much more as it supports markdown and JavaScript (Angular). So you can write code, hide it from your users, and create beautiful reports and share them. And you can also create real time reports and graphs and share them with your users using websockets.
Zeppelin supports many different language interpreters and features. For example:
| Alluxio | Kylin |
| Amgular | Lens |
| BigQuery | Livy |
| Cassandra | Markdown |
| ElasticSearch | Pig |
| Hadoop File operations | Psql |
| Flink | Python |
| Hbase | Linux shell (sh) |
| Ignite | Spark |
| JDBC |
And you can add 3rd party ones.
Below we give a Spark example. But first here is a little Markdown:
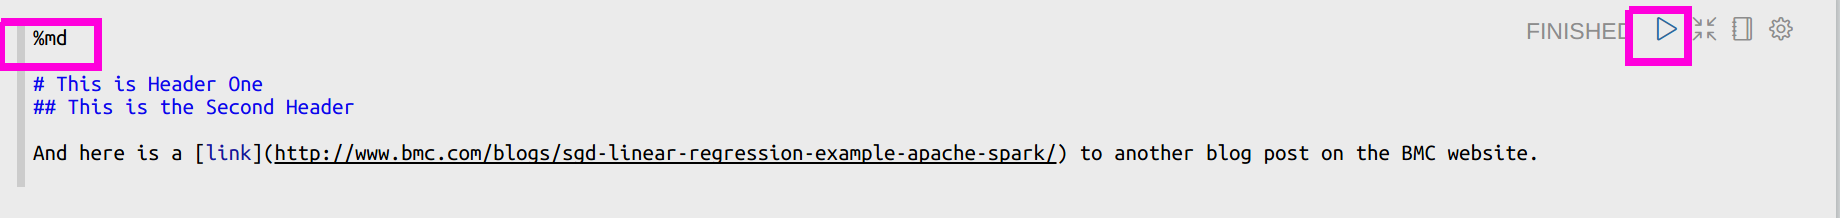
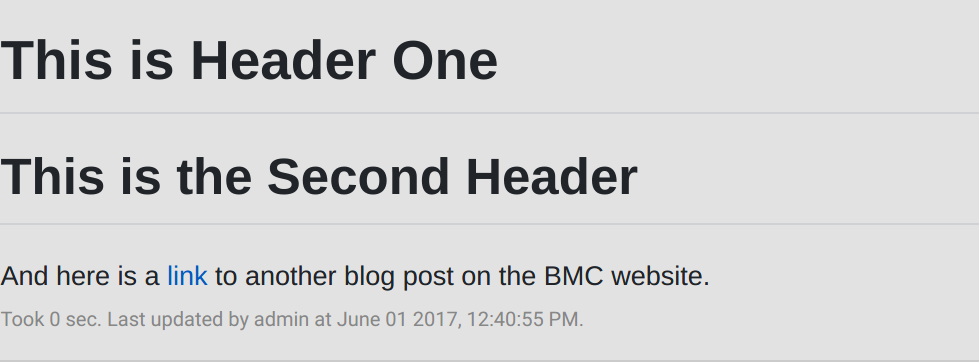
You click the arrow to run the code and it displays the text in markdown format, i.e., the same syntax to create README.md files at Github.
Install Spark
You could run Zeppelin as a Jupyter notebook already bundled with Spark, etc. Install it with apt-get or yum. We downloaded it from here. Then unzip it and copy conf/zeppelin-site.xml.template to conf/zeppelin-site.xml.
Then you might have to change the IP address it listens on from 0.0.0.0 to something else:
<property>
<name>zeppelin.server.addr</name>
<value>77.235.46.77</value>
<description>Server address</description>
</property>
Then start it:
bin/zeppelin-daemon.sh
Important note about security
If you set up Zepplin so that you can reach it over the public internet, then it is extremely important that you put a password on it. This is because someone can create a bash shell interpreter and do serious damage to your server. Follow the simple instructions from Zeppelin here to do that.
Spark example
Here we show a simple example of how to read a text file, convert it to a Spark dataframe, then query it using SQL to create a table display and graph.
- First download the data used in this example from here. Then copy it to the Hadoop file system or local file system.
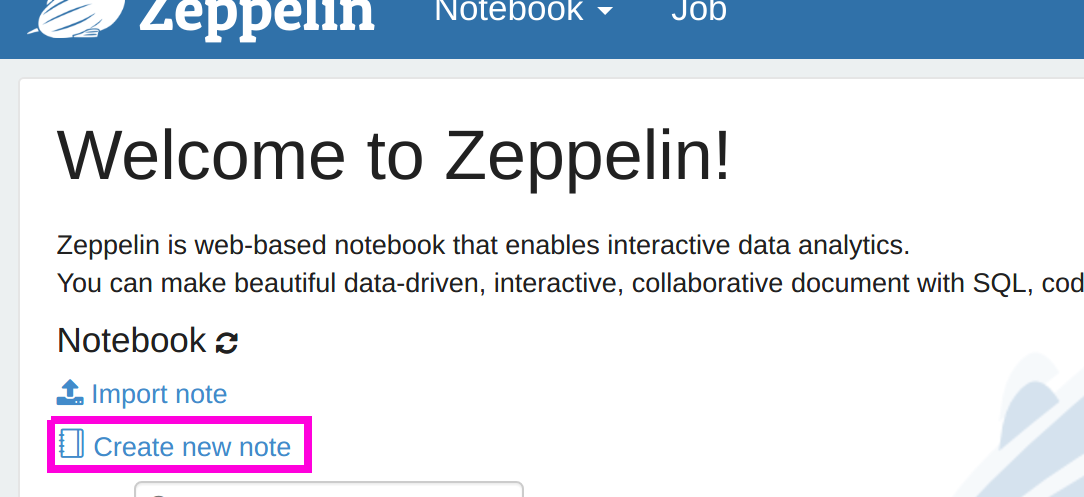
- Then open Zeppelin. It is usually listening on http://localhost:8080.
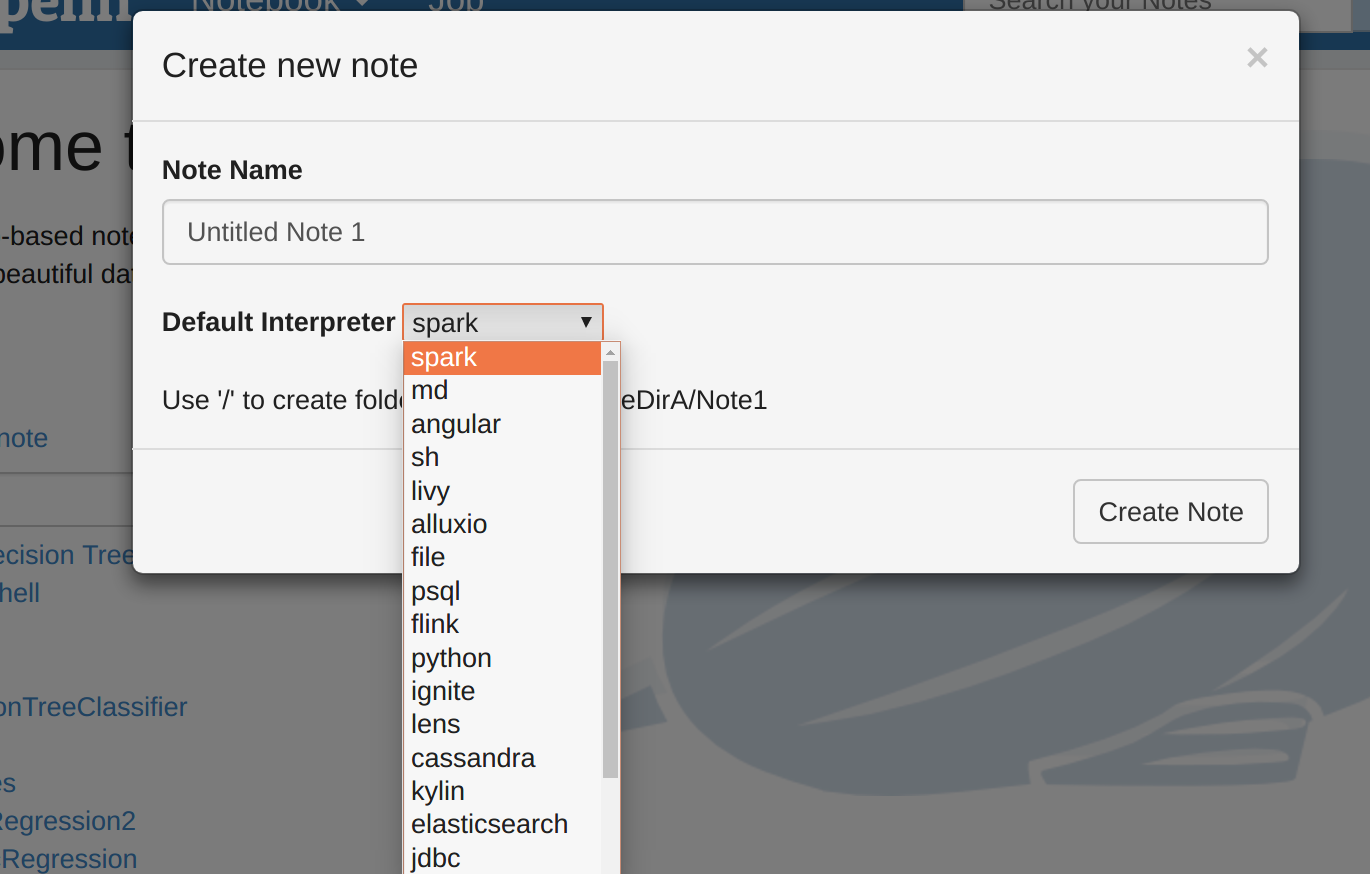
- Then click “Create new note.”
- Now select the Spark interpreter and give the notebook some name. It assumes that the Spark master is on the same server as Zeppelin. Note you can change the properties on the interpreter tab.
- Then post the code below into the cell shown below. Since we chose the interpreter Spark it is not necessary to make the first line %spark. Note: one annoying feature is that you cannot use the right mouse button and select past. Instead you have to use (-ctl-)(-v-).
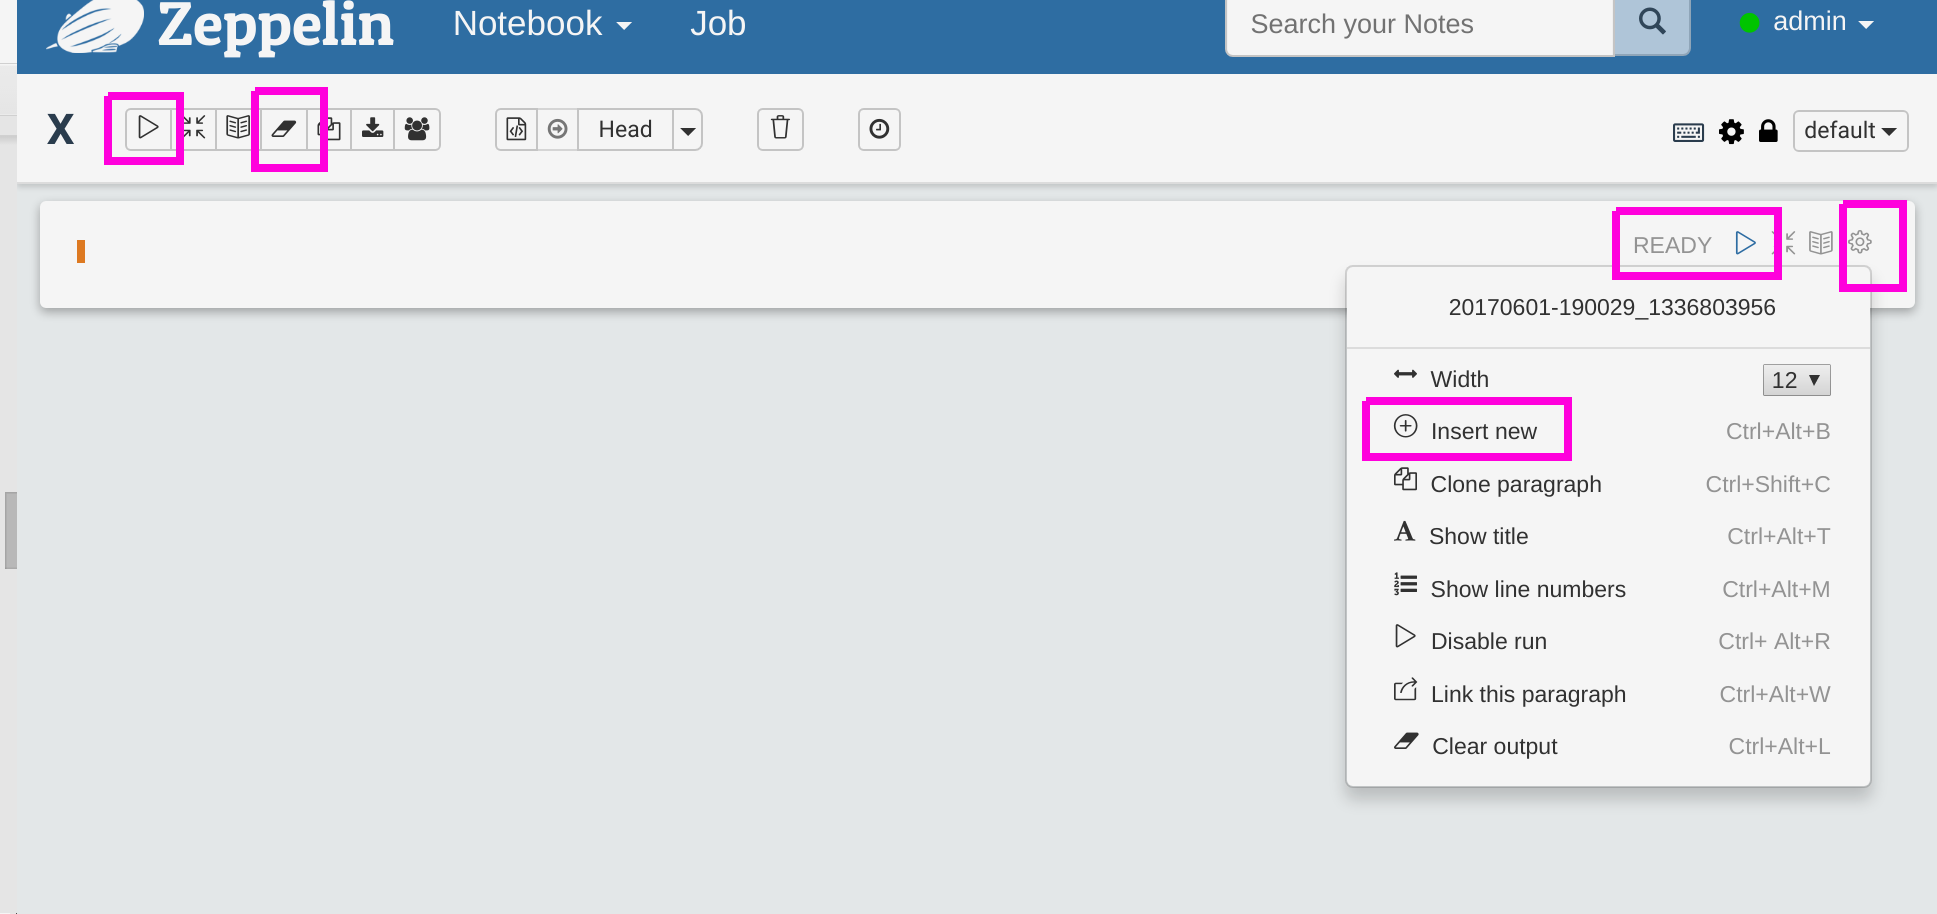
Below in pink we highlight some of the buttons. Reading left to right and top to bottom we have:
- Run code (called Paragraph)
- Clear output, meaning clear the results displayed
- Run one paragraph
- Access submenu
- Add a new paragraph
import org.apache.spark.sql.types._
import org.apache.spark.sql.{Row}
var data = sc.textFile("file:/home/walker/Downloads/lpsa.data")
val schemaStr = "a b c d e"
val fields = schemaStr.split(" ").map(fieldName => StructField(fieldName, DoubleType, nullable = true))
val schema = StructType(fields)
val parsedData = data.map( l => l.replace(",", " ").split(" "))
case class DataClass(a: Double, b: Double, c: Double, d: Double, e: Double)
var x = parsedData.map(b => DataClass(b(0).toDouble, b(1).toDouble, b(2).toDouble, b(3).toDouble, b(4).toDouble))
var df = x.toDF()
df.createTempView("df")
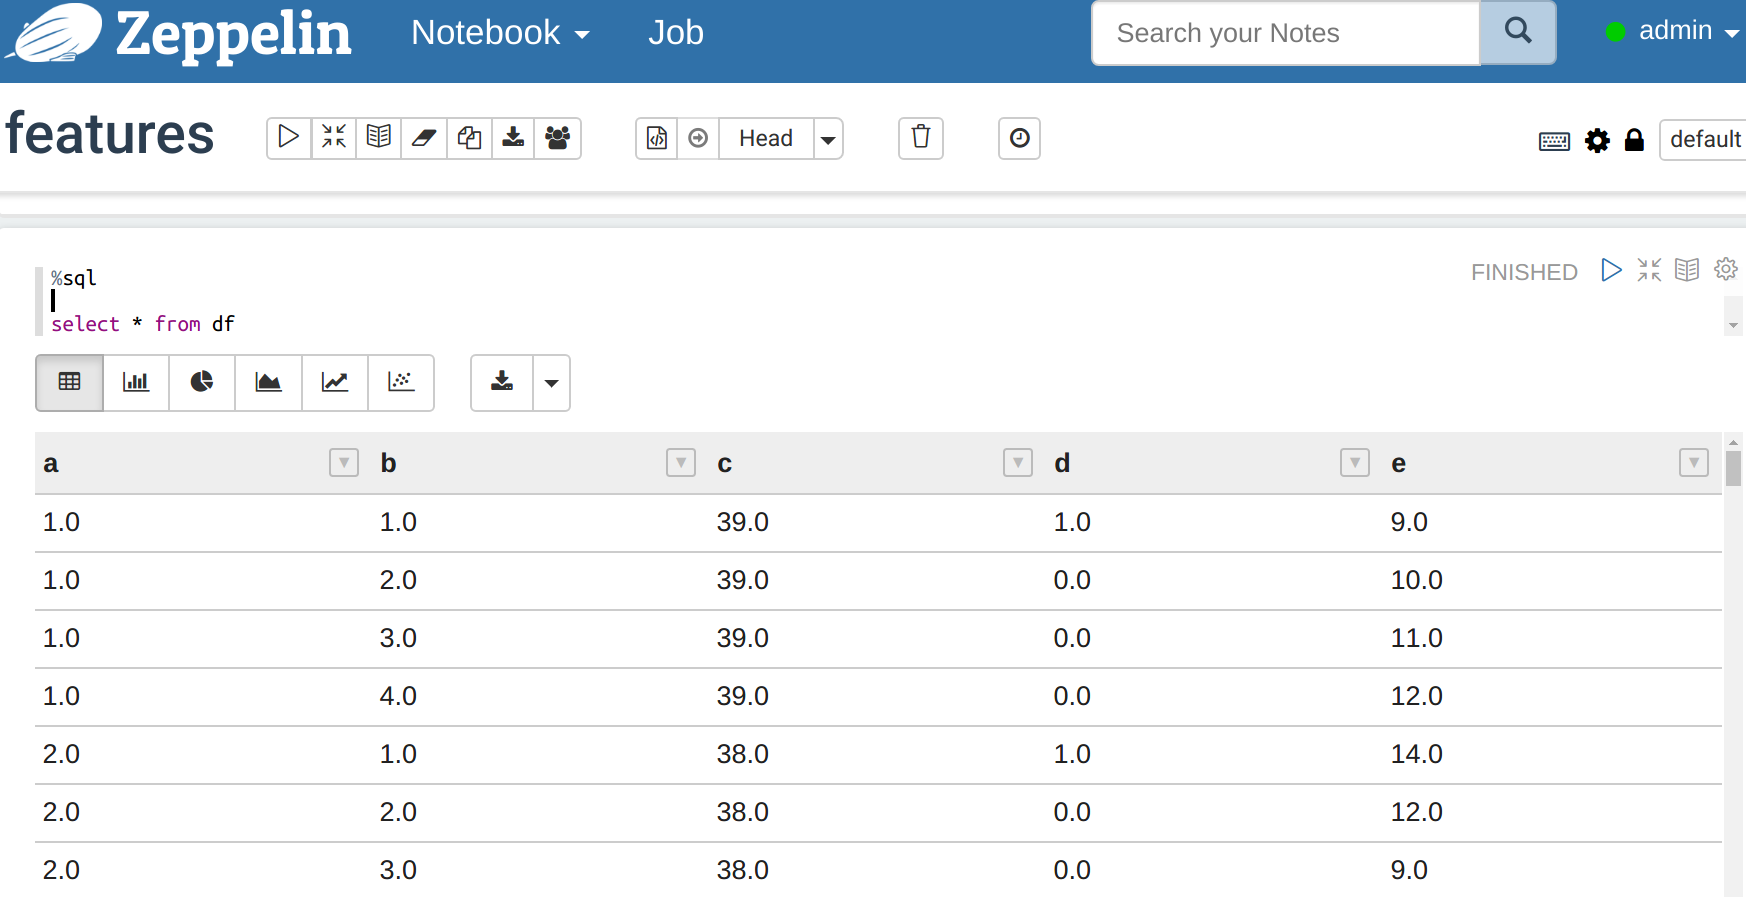
- Now in the next paragraph in the interpreter you can use regular SQL again the table you just registered as a temporary table. Enter the code below and run it. Then look at the data below. Now there are buttons where you can create graphs.
%sql
select * from df
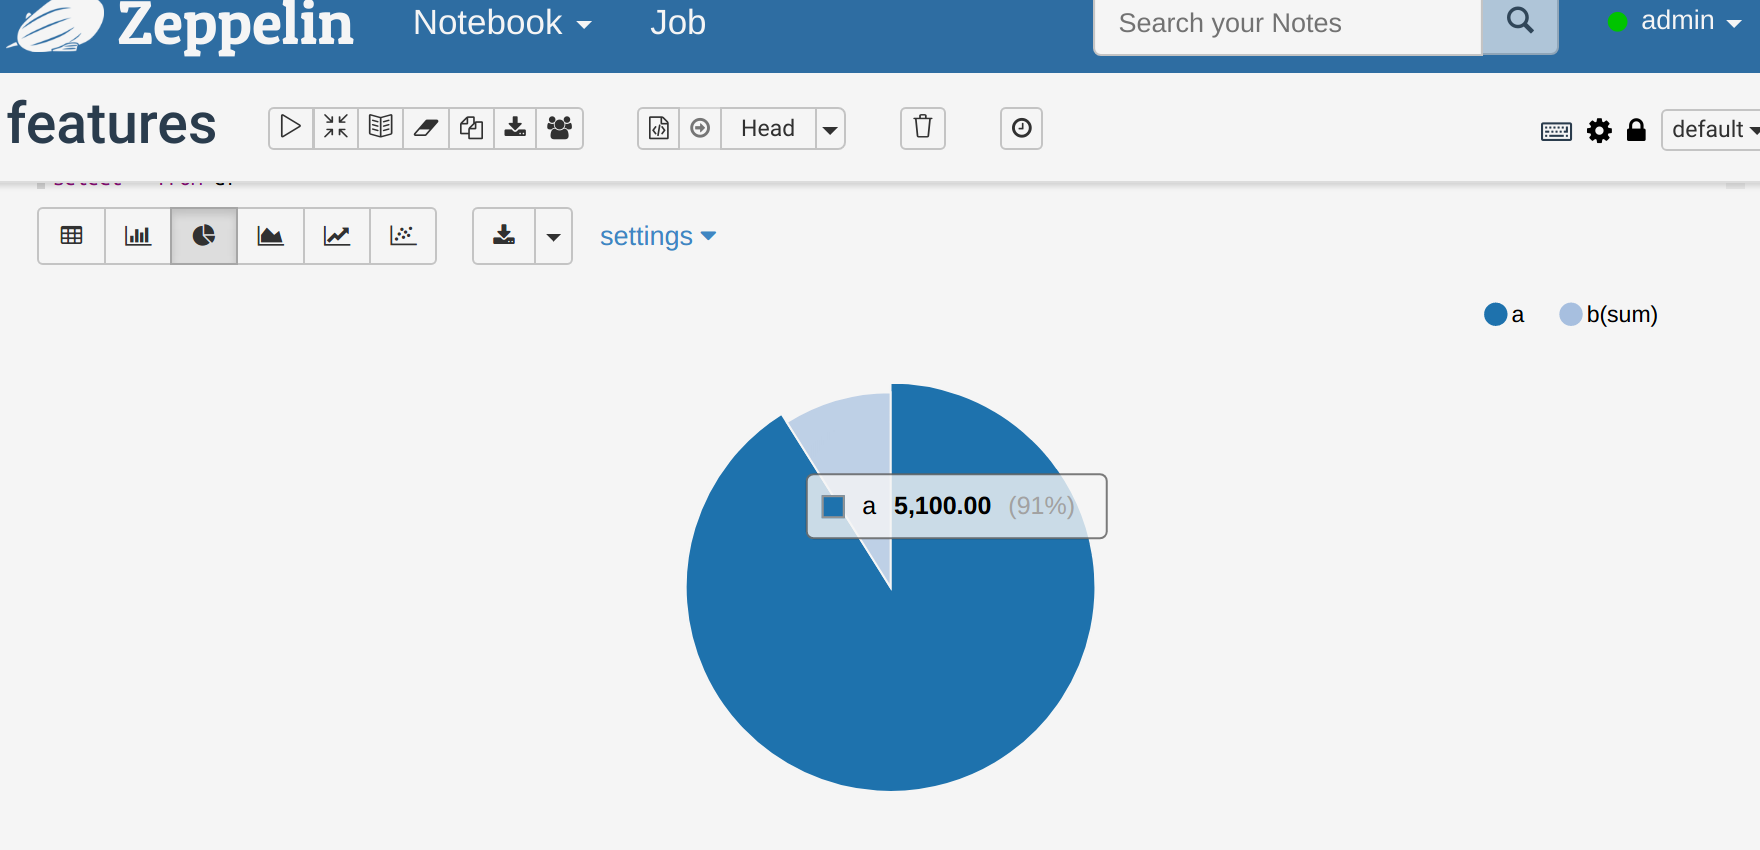
Click the pie chart icon and now you have a pie chart. (Here we selected only 2 columns. Change that under the settings option.)
My experience is that Zeppelin is kind of buggy. It seems to lose notebooks at times, it does not always update variables, and the graph feature crashes. So you might have to delete paragraphs and put them back etc. to fix those. Also export your notebooks to JSON format to have a backup.
From here you can practice with Spark, JDBC, other big data databases, or %angular if you know HTML and JavaScript add push buttons, or input fields, or other. You can also connect Zeppelin to your Github account to save the code there and support versions. You can also store it in Amazon S3 or Windows Azure. If you lose one it is stored in the <zeppelin install>/notebook folder with a name that is the same as the URL of your notebook, so for http://localhost:8080/#/notebook/2CJJYEZTG it will be stored in JSON format in the folder notebook/2CJJYEZTG.
These postings are my own and do not necessarily represent BMC's position, strategies, or opinion.
See an error or have a suggestion? Please let us know by emailing blogs@bmc.com.