In this article, I’ll show how to use Kibana to monitor the nginx web server. We will use the nginx Filebeat module and, of course, Elasticsearch.
Kibana is the graphical front-end for Elasticsearch. Filebeat is one of several Elasticsearch data shippers; others are Logstash, Metricbeat, and Packetbeat, plus a couple of specialized ones.
Install Kibana and ElasticSearch
We use Docker since it’s the simplest way to install Kibana.
First, install ElasticSearch:
sudo docker pull docker.elastic.co/elasticsearch/elasticsearch:7.6.2
sudo nohup docker run -p 9200:9200 -p 9300:9300 -e "discovery.type=single-node"
docker.elastic.co/elasticsearch/elasticsearch:7.6.2&
Then you need the docker container ID to install and start Kibana. Run this command to get the container ID:
sudo docker ps
Now get a root shell. Then pass a routable IP address to Kibana using the SERVER_HOST environment variable. Otherwise Kibana will bind to localhost, which does no good since you can’t reach it across the network.
(Important note: To put Kibana on a public IP address, do not follow these steps. Instead, you’ll need to turn on security, which I don’t cover in this article. If you don’t turn on security, people running port scans against your service will find your Kibana install and be able to use it without logging in. Instead, I leave off security, set my firewall rules to allow access only from my designated IP address, and I follow these instructions.)
sudo -i
export SERVER_HOST="172.31.46.15"
nohup docker run --link(container id):elasticsearch -p 5601:5601 kibana:7.6.2&
Now open the console:
http://(ip address):5601/app/kibana#/home
Install Filebeat
You don’t need to install Filebeat in a container as the installation is simple and requires no configuration.
curl -L -O https://artifacts.elastic.co/downloads/beats/filebeat/filebeat-7.6.2-amd64.deb
sudo dpkg -i filebeat-7.6.2-amd64.deb
There is no configuration necessary, unless you have modified the log location in nginx, in which case you would need to put the paths in /etc/filebeat/modules.d/nginx.yml. Assuming you are using the regular nginx layout, just enable the nginx module.
sudo filebeat modules enable nginx
Now run this command to push the filebeat dashboards to Kibana:
sudo filebeat setup --dashboards
Loading dashboards (Kibana must be running and reachable)
Loaded dashboards
sudo filebeat setup -e
After a while it will stop, once it has installed the dashboards. So, start Filebeat like this:
sudo service filebeat start
Open the Kibana nginx Dashboard
The Kibana nginx dashboards are basic. For now, we’ll use the dashboards that nginx has created, although you can make your own dashboards for specific use cases. (Tutorial coming soon.)
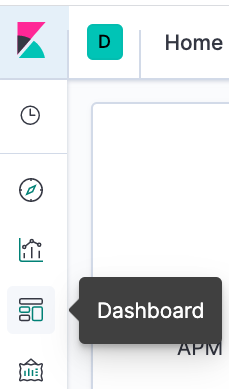
Go to the dashboards display:
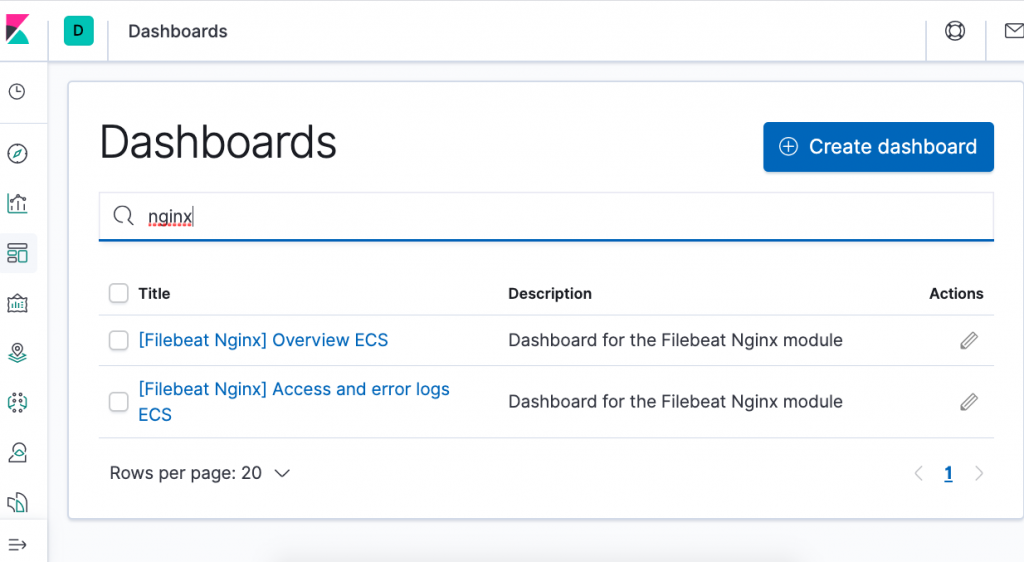
Then type the letters nginx to find the dashboard:
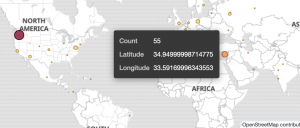
Now you will see charts on the dashboard. Here is the world map showing where your traffic comes from:
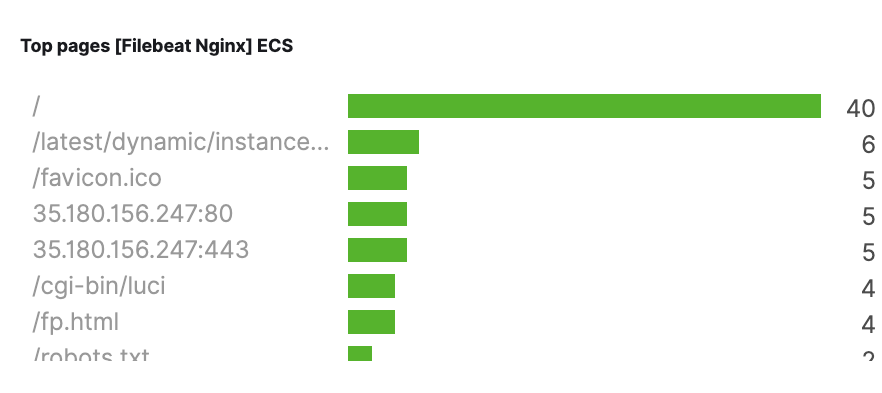
This shows the top pages:
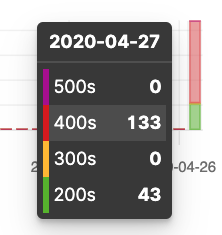
This shows page counts by status codes. One observation you can make here as this web server, as any public web server, is constantly being hit by hackers looking to see what vulnerabilities you have left exposed. That’s why there are so many HTTP error 400s (bad request) on this server.
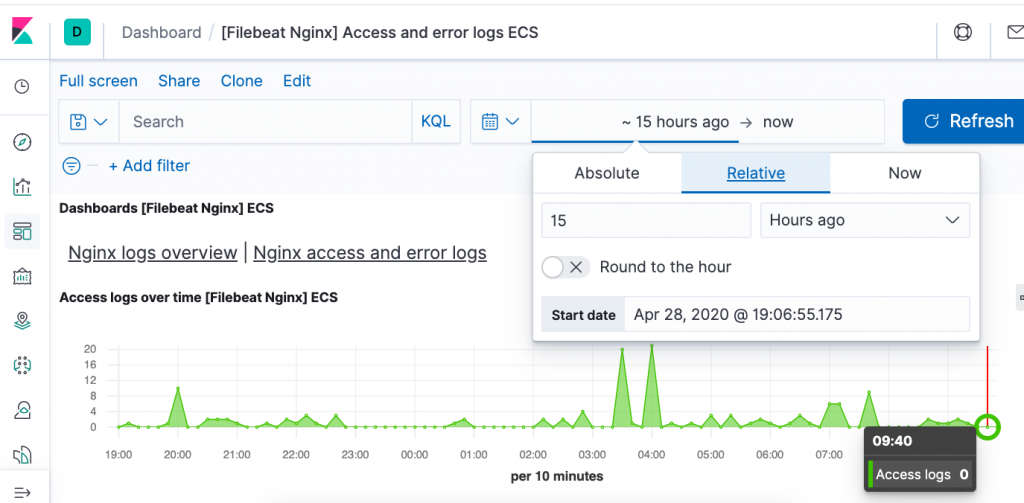
Set the time filter as it will default to the last 15 minutes:
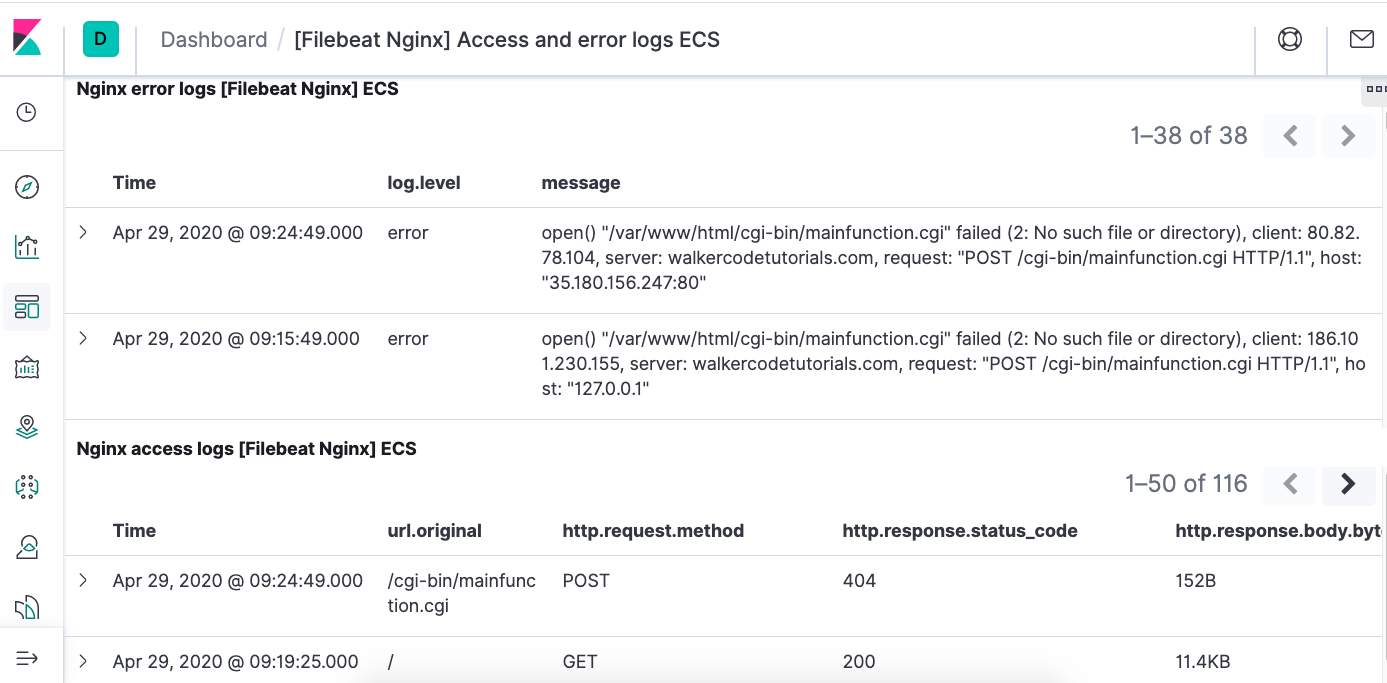
This view gives log details: