
Today we’re going to introduce some terms that are important to determining the accuracy and quality of regression models.
We illustrate these concepts using scikit-learn.
(This article is part of our scikit-learn Guide. Use the right-hand menu to navigate.)
How regression models are used
Understanding these metrics helps to determine whether regression models are accurate or misleading. Using the statistical technique of regression helps highlight patterns, trends, and relationships in data that provide insight into the future. You can see how independent variables affect dependent variables and the strength of those relationships.
The ability to see into possible futures and understand connections and dependencies is invaluable to planning for various scenarios, as well as assessing and addressing risks. Various high-stakes industries make extensive use of regression models, including:
- Finance
- Business analytics
- Engineering
- Healthcare
- Science
- Sports
- Computer science
Why R2 score is important in machine learning
The value of any regression model depends on its accuracy, specifically how well it explains data variances. That is why improving R2 score is so vital. Machine learning and AI work together to identify the right variables, fine-tune models for improved predictions, and capture hard-to-identify relationships in massive data sets that are complex and nonlinear.
AI and machine learning improve how a model fits with or explains data variations, making it more accurate in making predictions. It reduces underfitting (missing key relationships) and overfitting (which brings in meaningless noise). It helps in choosing just the right variables, avoiding those that bring bias or wasteful redundancy to a model. The goal is an efficient model that produces accurate results and supports better predictions.
Learn more in Bias-Variance Tradeoff in Machine Learning.
Looking at examples brings these concepts to life for better understanding. Let’s use the code from our last blog post, and add additional logic. In the last blog post, we made the independent y and dependent variable x correlate to illustrate the basics of how to do linear regression with scikit-learn. This time, we’ll introduce some randomness in the dependent variable (y) so that there is some error in our predictions.
Getting started with AIOps is easy. Learn how you can manage escalating IT complexity with ease! ›
What is variance?
In terms of linear regression, variance is a measure of how far observed values differ from the average of predicted values (i.e., their difference from the predicted value mean). The goal is to have a value that is low, as quantified by the R2 score (explained below).
In the code below, this is np.var(err), where err is an array of the differences between observed and predicted values and np.var() is the numpy array variance function.
What is the R2 score?
The R2 score is “…the proportion of the variance in the dependent variable that is predictable from the independent variable(s)”, according to Wikipedia. A mathematical definition is “(total variance explained by model) / total variance.” So if it is 100%, the two variables are perfectly correlated (i.e., no variance at all).
The R2 score varies between 0% and 100%. It is closely related to the MSE (see below), but not the same.
In most cases, a low value shows a low level of correlation, meaning a regression model that is not valid.
Reading the code below, we do this calculation in three steps to make it easier to understand. Firstly,
g
is the sum of squared differences between the predicted values and the actual observed values: (ytest[i] – preds[i])². Separately, the total sum of squares is calculated using the squared difference between each observed value and the mean of the observed values: (ytest[i] – np.mean(ytest))². The results are then printed as follows:
print ("total sum of squares", y)
print ("ẗotal sum of residuals ", g)
print ("r2 calculated", 1 - (g / y))
Our goal here is to explain. We can of course let scikit-learn to this with the r2_score() method:
print("R2 score : %.2f" % r2_score(ytest,preds))
What is mean square error (MSE)?
Mean square error (MSE) is the average of the square of the errors. The larger the number the larger the error. Error in this case means the difference between the observed values y1, y2, y3, … and the predicted ones pred(y1), pred(y2), pred(y3), … We square each difference (pred(yn) – yn)) ** 2 so that negative and positive values do not cancel each other out.
How to calculate MSE in Python
So here is the complete code for calculating MSE:
import matplotlib.pyplot as plt
from sklearn import linear_model
import numpy as np
from sklearn.metrics import mean_squared_error, r2_score
reg = linear_model.LinearRegression()
ar = np.array([[[1],[2],[3]], [[2.01],[4.03],[6.04]]])
y = ar[1,:]
x = ar[0,:]
reg.fit(x,y)
print('Coefficients: n', reg.coef_)
xTest = np.array([[4],[5],[6]])
ytest =  np.array([[9],[8.5],[14]])
preds = reg.predict(xTest)
print("R2 score : %.2f" % r2_score(ytest,preds))
print("Mean squared error: %.2f" % mean_squared_error(ytest,preds))
er = []
g = 0
for i in range(len(ytest)):
print( "actual=", ytest[i], " observed=", preds[i])
x = (ytest[i] - preds[i]) **2
er.append(x)
g = g + x
x = 0
for i in range(len(er)):
x = x + er[i]
print ("MSE", x / len(er))
v = np.var(er)
print ("variance", v)
print ("average of errors ", np.mean(er))
m = np.mean(ytest)
print ("average of observed values", m)
y = 0
for i in range(len(ytest)):
y = y + ((ytest[i] - m) ** 2)
print ("total sum of squares", y)
print ("ẗotal sum of residuals ", g)
print ("r2 calculated", 1 - (g / y))
Results in:
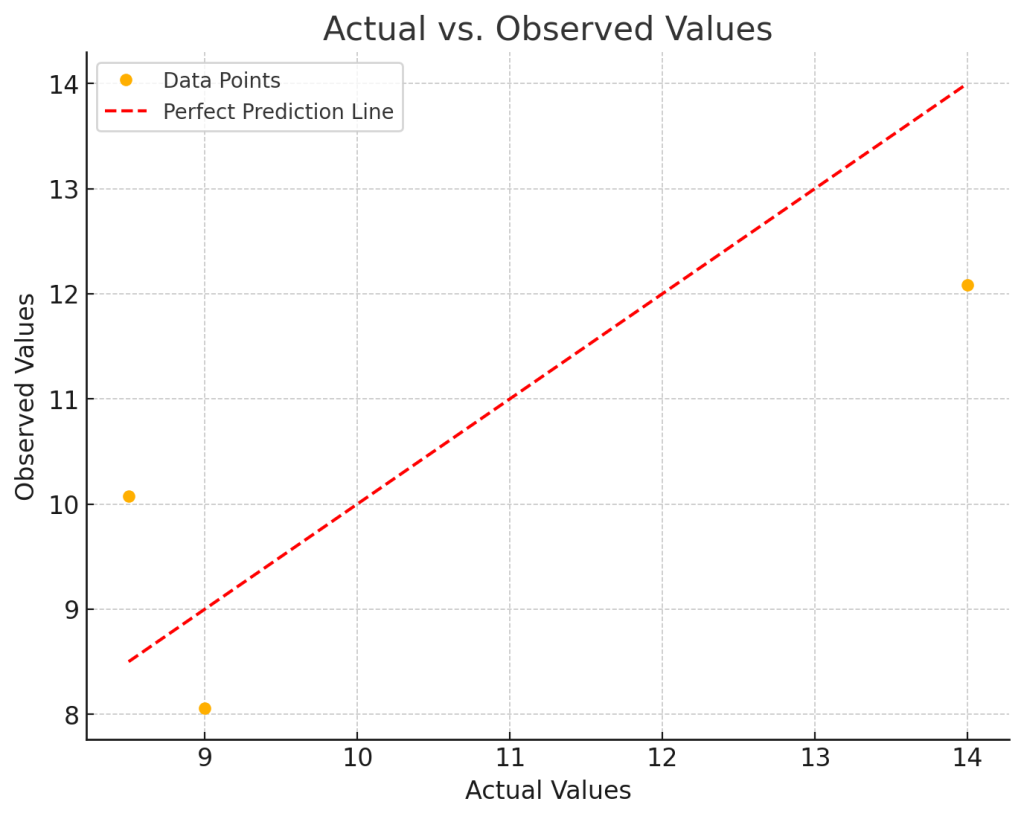
Coefficients:
[[2.015]]
R2 score : 0.62
Mean squared error: 2.34
actual= [9.] observed= [8.05666667]
actual= [8.5] observed= [10.07166667]
actual= [14.] observed= [12.08666667]
MSE [2.34028611]
variance 1.2881398892129619
average of errors 2.3402861111111117
average of observed values 10.5
total sum of squares [18.5]
ẗotal sum of residuals [7.02085833]
r2 calculated [0.62049414]
You can see by looking at the data np.array([[[1],[2],[3]], [[2.01],[4.03],[6.04]]]) that every dependent variable is roughly twice the independent variable. That is confirmed as the calculated coefficient reg.coef_ is 2.015.
What is a good Mean Squared Error (MSE)?
There is no correct value for MSE. Simply put, the lower the value the better and 0 means the model is perfect. Since there is no correct answer, the MSE’s basic value is in selecting one prediction model over another.
Similarly, there is also no correct answer as to what R2 should be. 100% means perfect correlation. Yet, there are models with a low R2 that are still good models.
Interpreting r2 and MSE together
Our take away message here is that you cannot look at these metrics in isolation in sizing up your model. You have to look at other metrics as well, plus understand the underlying math. We will get into all of this in subsequent blog posts.
Additional Resources
Extending R-squared beyond ordinary least-squares linear regression from pcdjohnson
These postings are my own and do not necessarily represent BMC's position, strategies, or opinion.
See an error or have a suggestion? Please let us know by emailing blogs@bmc.com.