Here we show how to stress test a Cassandra cluster using the cassandra-stress tool.
What this tool does is run inserts and queries against a table that it generates by itself or an existing table or tables.
(This article is part of our Cassandra Guide. Use the right-hand menu to navigate.)
The Basic Flow
The test works like this:
- Insert random data. You specify the length of text fields or random numeric values by selecting a fixed value or a statistical distribution such as a normal, uniform, or other distribution. The normal distribution are values drawn from some mean and standard deviation, i.e. the familiar bell curve. The uniform distribution is random numbers drawn from a range like 1,2,3,….
- Run select statements using the values generated.
- Calculate the time in milliseconds to run each operation.
- Calculate the mean time, standard deviations number of garbage collections etc. for each iteration. This gives you an average and the bell curve so you can see how widely your operations are disbursed. It gives you graphs over time so you can see whether performance degrades over time. Lots of operations far from the mean indicate a high level of variance. This could point to items you need to tune, such as indexes, partitions, add more memory, etc.
Test Setup
You need a Cassandra cluster. If you do not have one yet follow these instructions.
We need to create a keyspace, table, and index and to create a stress test configuration file in YAML format.
Now deactivate Python 2.7 virtual environment, if you are using that, then run cqlsh. Paste in the following Cassandra SQL.
CREATE KEYSPACE Library
WITH REPLICATION = { 'class' : 'SimpleStrategy', 'replication_factor' : 3 };
CREATE TABLE Library.book (
ISBN text,
copy int,
title text,
PRIMARY KEY (ISBN, copy)
);
create index on library.book (title);
Now, create a text file named stress-books.yaml and paste the following into it. This is a YAML format, so don’t mess up the indentation.
Below we explain the fields.
keyspace: library
table: book
columnspec:
  - name: text
    size: uniform(5..10)
    population: uniform(1..10)
  - name: copy
    cluster: uniform(20..500)
  - name: title
    size: uniform(5..10)
insert:
  partitions: fixed(1)
  select: fixed(1)/500
  batchtype: UNLOGGED
queries:
   books:
      cql: select *  from book where title = ?
      fields: samerow
The field names are:
| keyspace | Name of existing keyspace. You could also put SQL here to create one if it does not exist. |
| table | Name of existing table. You could also put SQL here to create one if it does not exist. |
| insert, queries | These are the functions we will call. The insert does the insert and the queries/books does the query we put there. It runs queries against the values inserted in the batch it just ran. |
| columnspec: – name: text size: uniform(5..10) | There is one columnspec for each value we want to populate. The size is the length of the field. uniform(5..10) means to generate a text string from 5 to10 characters. If it was a numeric field it would create random numbers in that range. |
| insert: partitions: fixed(1) select: fixed(1)/500 batchtype: UNLOGGED | This means to insert a fixed number of rows in each partition in each batch. We explained batch operations here. |
Run the Stress Test
Run the command below to start the test. The arguments are:
cassandra-stress user profile=stress-books.yaml ops\(insert=1,books=1\) n=10000 -graph file=stress.html
| user profile=stress-books.yaml | means use stress-books.yaml for instructions. |
| n=10000 ops\(insert=1,books=1\) | Here we say run 10,000 batches and for each run the insert code 1 time and the books code 1 time. If you leave this off it will run until the standard deviation of the error is < 0.2. |
| -graph file=stress.html | This will create an html file called stress.html that will graph the results of different metrics. |
The output is quite long. Here is part of it truncated.
******************** Stress Settings ********************
Command:
Type: user
Count: 10,000
…
Connected to cluster: Walker Cluster, max pending requests per connection 128, max connections per host 8
Datatacenter: datacenter1; Host: localhost/127.0.0.1; Rack: rack1
Generating batches with [1..1] partitions and [0..1] rows (of [20..500] total rows in the partitions)
Sleeping 2s...
Warming up insert with 500 iterations...
Warming up books with 500 iterations...
Thread count was not specified
It will echo metrics for each batch iteration. You can copy and paste this test and then import it into Excel or Google Sheets to make that easier to read.
type       total ops,    op/s,    pk/s,   row/s,    mean,     med,     .95,     .99,    .999,     max,   time,   stderr, errors,  gc: #,  max ms,  sum ms,  sdv ms,      mb
books,          1003,    1003,     383,     387,     5.0,     3.9,    12.5,    20.2,    29.7,    40.7,    1.0,  0.00000,      0,      2,      10,      18,       1,     319
insert,          825,     825,     825,     934,     2.7,     2.0,     7.3,    12.1,    16.9,    23.8,    1.0,  0.00000,      0,      2,      10,      18,       1,     319
total,          1828,    1828,    1208,    1321,     4.0,     2.9,    11.1,    18.1,    27.2,    40.7,    1.0,  0.00000,      0,      2,      10,      18,       1,     319
books,          1096,     930,     350,     360,     5.8,     3.9,    14.1,    27.4,    33.3,    33.3,    1.1,  0.11339,      0,      0,       0,       0,       0,       0
insert,          904,     790,     790,     910,     3.0,     2.3,     9.0,    12.1,    12.3,    12.3,    1.1,  0.11339,      0,      0,       0,       0,       0,       0
total,          2000,    1720,    1140,    1270,     4.5,     3.2,    11.9,    21.9,    33.3,    33.3,    1.1,  0.11339,      0,      0,       0,       0,       0,       0
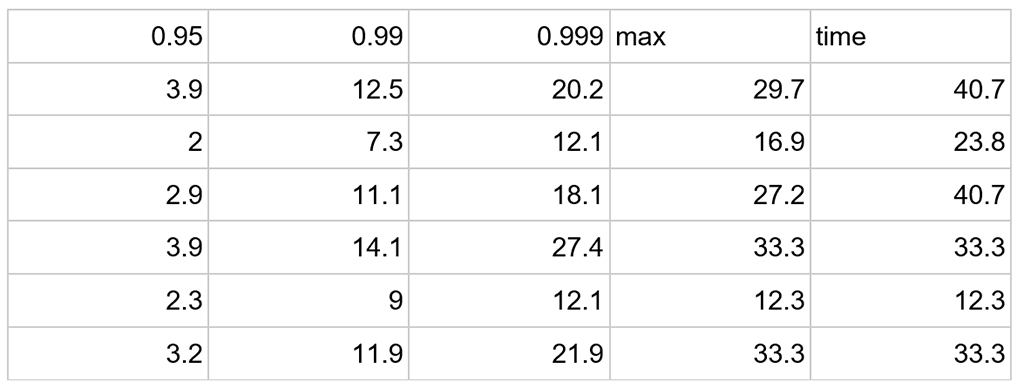
Do that and then the spreadsheet is easier to read.
This shows the total numbers of inserts and selects (books is what we named that) and the mean (average) number of milliseconds required to do that. In this example I ran earlier it ran 2,000 times.

A statistician looking at this would want to know 2, 3, and 4 standard deviations from the mean. That corresponds to 95%, 99%, and 99.9% of the transactions. In other words those are far from the mean.
Below is the right-hand side of the spreadsheet. Not all the metrics can fit onto this screen, such as number of garbage collections (the number of times that the Java Virtual Machine had to clear its cache. When it does that all operations pause.) But this does not matter as the HTML file will give the complete picture.

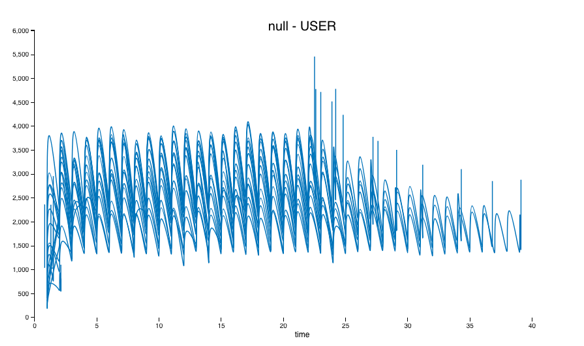
Open the file stress.html with a browser.
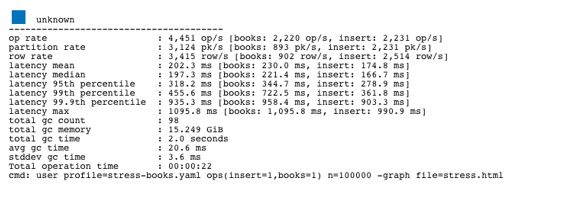
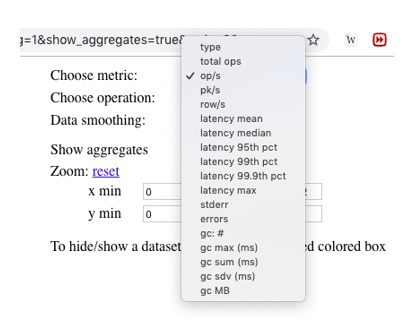
You can see that the test took 22 seconds running on my 2 cluster t2.large Amazon Ubuntu machines. The spikes in operation time coincided with garbage collections. You can see that by selecting the gc# option in the graph type drop down.

The stats show that the average throughout was 2,231 inserts per second.

You can pick from the drop down at the top right of the chart to plot different metrics.

These postings are my own and do not necessarily represent BMC's position, strategies, or opinion.
See an error or have a suggestion? Please let us know by emailing blogs@bmc.com.


