Better performance and scalability of an application do not always depend on the amount of memory allocated. There are often occasions where allocating more memory has resulted in an adverse situation. This blog explores the adverse impact of performance degradation and explains how to create a balance while allocating memory to Java applications.
Enterprise applications sizing background
For this exercise, we will refer to our in-house IT operations product, which is being used for the end-to-end operations management of our own IT business unit as well as multiple enterprise-level customers. It’s important to understand the volumetrics that the solution will be monitoring. This will help us reverse engineer and map the numbers to our BMC-recommended system requirements, which are documented as part of the sizing and scalability guidelines. Once this mapping is established, it becomes less complicated to size the IT operations stack.
You can find additional information on presentation server sizing and scalability here and information on infrastructure management server sizing and scalability here.
Does the process need extra memory?
Once deployed, we should make it a practice to monitor the health of the stack. This will help us to understand whether any modifications are needed to meet changing business requirements. In addition, any performance degradation in the stack will proactively trigger an alarm, making it easier for us to remediate before end users are impacted.
Different layers of monitoring include:
- Monitoring the logs from the application
- Operating system monitoring
- Java Virtual Machine (JVM) monitoring
The Java Development Kit (JDK) comes bundled with VisualVM, which helps us to get a holistic view of the running JVMs, including overall memory consumption and the respective threads associated with the same.
The above analysis will help us investigate further and may result in enhancing or reducing current resources allocated to the stack. We would need to map the findings according to the sizing documents referenced above and look for discrepancies, based on the specific process or thread that we are analyzing.
Can you increase the memory allocation for processes directly?
The answer is NO. We should always be mindful of making changes to the resource in the running stack. The reason is there are multiple entities tightly coupled together in the stack (e.g., it’s not a standalone single-layer application), so resource changes to one entity will negatively or positively impact the related entities, leading to new issues in the stack and further degrading the performance of the application.
Example of garbage collection setting which worked for an application
Below are the Java 8 parameters that we would normally use, especially while tuning garbage collection. This is applicable to the Garbage-First Garbage Collector (G1 GC).
- XX:+DisableExplicitGC
- XX:+G1NewSizePercent
- XX:+MaxGCPauseMillis
- XX:+XX:MaxMetaspaceSize
- XX:+MaxMetaspaceSize
- XX:+UseCompressedOops
- XX:+UseStringDeduplication
- XX:+UseG1GC
With respect to the operations management application, we made changes based on our observation for the G1 GC parameters. Below are the properties that we considered before and after making the changes.
Before making the changes:
From G1 GC:
- Option=XX:+UseG1 GC
- Option=XX:MaxGCPauseMillis=200
- Option=XX:ParallelGCThreads=20
- Option=XX:ConcGCThreads=5
- Option=XX:InitiatingHeapOccupancyPercent=70
After making the changes to the parallel GC:
- Option=Dsun.rmi.dgc.client.gcInterval=3600000
- Option=Dsun.rmi.dgc.server.gcInterval=3600000
Here, we ran the collection every hour and performed a parallel garbage collection (GC). This helped us to reduce the CPU footprints while the G1 GC was executed. Overall process memory usage is also controlled with fixed-interval GC cycle runs.
This may not work correctly if we don’t have proper heap settings. If the setting is very low, then the GC may be invoked before the above hourly interval, running automatically instead of when we want it to run. Normally, increasing the max heap by a factor of 20 percent is a good start to confirm whether the GC is being invoked every hour.
There have been instances where the application indicates that the process is running out of memory but internally the respective JVM is not using that much memory. In this case, the application process’s JVM needs a max heap allocation, but due to limited resource availability, the OS could not release the max to the JVM process. This results in an out-of-memory error due to incorrect heap settings and insufficient RAM available to the VM—it’s not a JVM process error.
Normally, we would see an exception similar to java.lang.OutOfMemoryError: unable to create new native thread, which indicates that Java demanded the memory chunk but there was insufficient RAM available on the server. In this case, adding extra heap space will not help.
In these kinds of scenarios where the overall RAM of the machine is not properly allocated, the role of GC becomes critical. In addition, if the GC cycles are not run properly, this leads to the piling of objects in the heap memory with both direct and indirect references. It can also take more processing CPU time/performance to do the cleanup when the GC executes.
Most of these would be inactive, or not-live, objects, but an inadequate or infrequent GC cycle leads to unnecessary heap consumption with these objects. This kind of issue leads us to modify some of the properties as shown above.
Below is a snapshot where the JVM required more memory, but it had reached max heap.
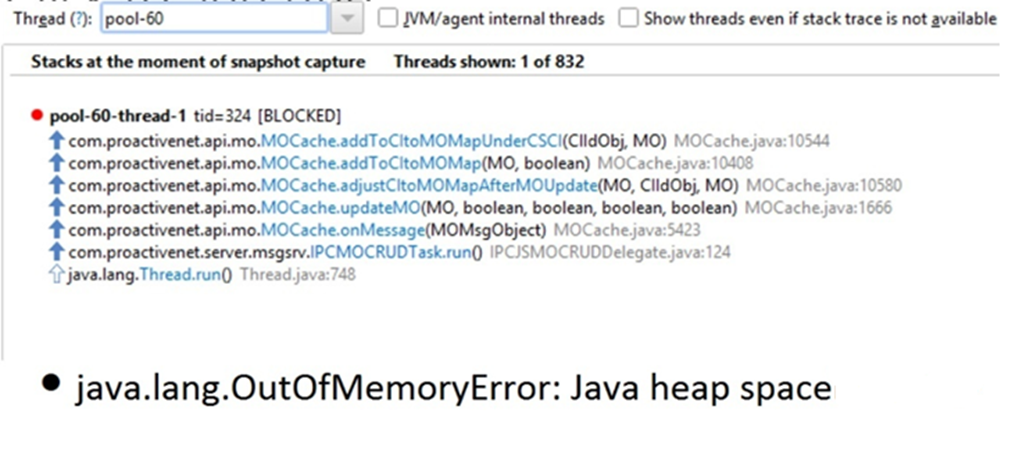
Figure 1. JVM reaches max heap.
The following shows the potential to go OutOfMemory (OOM) because of heap.
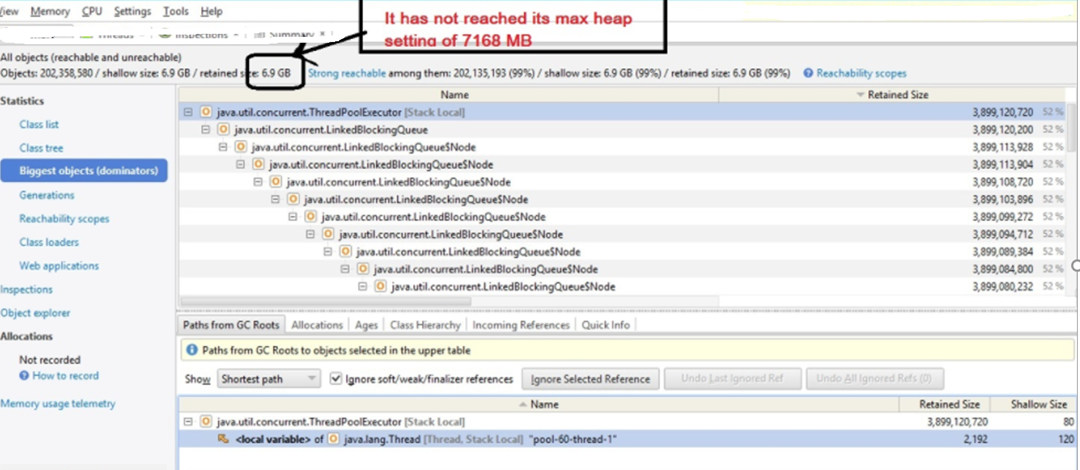
Figure 2. JVM nearing OutOfMemory and crashes.
Using BMC products to monitor these JVM processes, we get a memory graph that indicates that the JVM had 32 GB RAM, all of which has been utilized, so any further requests by the JVM processes cannot be handled by the OS and the JVM process crashes, as shown above.
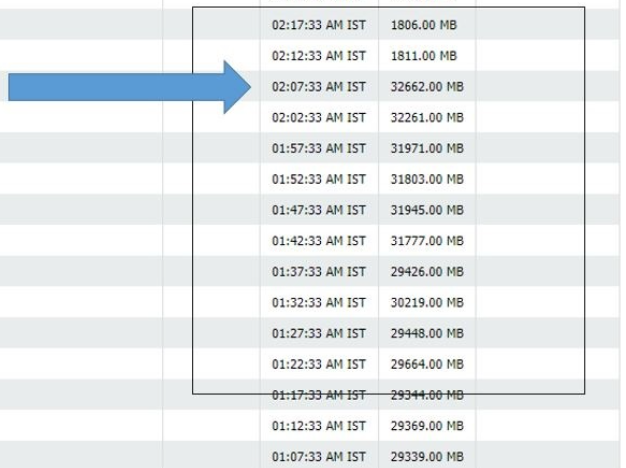
Figure 3. JVM utilizing 32 GB of memory.
The above illustration shows that increasing the JVM heap does not always help to mitigate the OOM situation. There could be additional factors like how much RAM is available on the VM and whether the OS has enough memory to release to the JVM process.
We had another instance from a customer where one of the JVM processes was running out of memory. The end impact was the application crashed, generating a memory dump file.

Figure 4. Snapshot from the memory dump.
The above stack showed where the OOM happened; drilling down more, we could see the actual issue.


Figure 5. The operation that triggered the issue.
This is again another scenario where an end user would be prompted to increase the JVM process allocation, which may resolve the problem for a couple of days, but it will eventually crash with the same error.
In this case, we had to handle this specific issue through code optimization.
Does the server have the right memory allocated?
Most virtual machine (VM) servers have shared resources. When there is a sudden chunk of memory needed for a server, there should not be scarcity in the VM pool.
Let’s keep in mind that CPU and memory are proprietary to the nodes or the VM itself, where the application is installed. Even before we install any specific application, we allocate CPU and memory to the VM.
Within the application, it’s up to the vendor (application developer) to determine how the CPU and memory would be allocated for the seamless performance of the solution. This is where, based on our sizing recommendation, we allocate memory to the running JVM processes.
But how do we make sure these allocations at the VM level are the best possible numbers we could imagine? Well, there is no straightforward answer to this, as this depends on monitoring the VM nodes using capabilities both inside and outside the solution.
On the IT operations solution end, BMC has come up with a knowledge module called the VMware vSphere Knowledge Modules (VSM KM). This specific KM is used to monitor the entire virtual center (VC) where our application is running, with respect to memory and CPU. These are metrics that reveal the health of the VC.

Figure 6. CPU utilization metric.
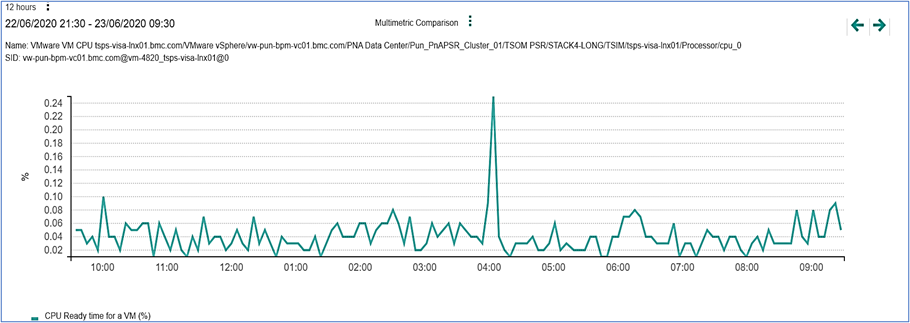
Figure 7. CPU ready time.
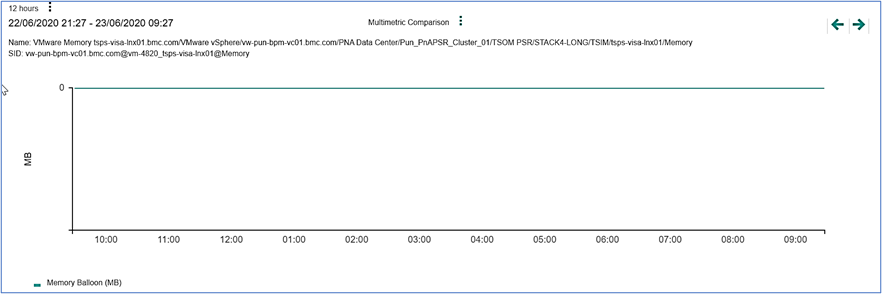
Figure 8. Memory balloon.

Figure 9. Memory used.
Using the virtual center monitoring tool
Monitoring the VC will help us to understand scenarios where the solution itself is down and we don’t have the built-in capability for VC monitoring. Based on our experience, we have isolated a few metrics and a performance chart, which help us to understand the overall health of the VC, as follows.
ESX overprovisioned
- Memory overcommitment
- CPU overcommitment
Memory ballooning
- Should not happen if host is performing as per expectation
Storage latency
- Response of the command sent to the device, desired time within 15-20 milliseconds
VC dashboard
- This will alert us to any open alarms regarding the health of the VC and respective VMs
Datastore
- The datastore of the VM where our IT operations is installed; should be in a healthy condition with sufficient space available
Performance chart
- Verify the performance chart for memory and CPU from the VC level
How these help
These monitoring metrics help us to identify the potential impact on the overall performance of the IT operations solution when proper CPU and memory are not allocated within the application, dependent on their availability to the VM nodes themselves.
Conclusion
It’s very important to monitor and understand how much CPU and memory we are allocating to the VM nodes so we can adjust to the lowest level possible. At the highest level, they will affect garbage collection performance.
For more information on this topic, please see our documentation on hardware requirements to support small, medium, and large environments here.


