Opensource software by definition earns no money for its creators, since it’s free. The primary sponsor then hopes larger companies will sign up for the enterprise product, for which they charge money. That way the user gets offer support, consulting, and it unlocks different features.
For example, ElasticSearch is free, but with the enterprise edition you get machine learning and other features, for a free. Here we show you the Elastic Cloud, hosted version of ElasticSearch.
Opensource companies recently have begun to host clusters themselves. This make this cheaper for its users that buying the product outright. It lets users pay monthly instead of up front.
The CFO loves that, as the company can write off operating costs immediately instead of having to amortize them over time. That’s a fancy way of saying they can reduce their taxes sooner than later.
But for technical people like us, it makes the deployment and maintenance easier.
Here we discuss how ElasticSearch has done this with the Elastic Cloud. In short, the takeaway message is that you work with it the same as if you had installed it yourself. The only difference is you don’t have ssh access to the instances. But you don’t need that since you can use ssh from any other computer to get to those.
Getting Started
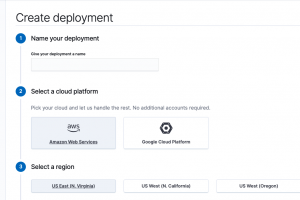
You can get a free 14 day Elastic Cloud trial at https://cloud.elastic.co/. It’s easy to get started, you just create a Deployment and ElasticSearch installs a cluster for you at either Amazon AWS or the Google Cloud as the screen below shows.
The screen look familiar to those of you who have used AWS. It asks you for what region you want your servers and what size hardware, meaning EC2 template.
You can select more memory, a necessity in any production use, storage and nodes on the customization screen. As you can see that is not possible with the trial version.
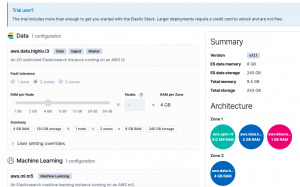
Then it automatically rolls out a the ElasticSearch servers and the Kibana front end. It gives you an internet domain name so anyone in your organization can access it. It install the SSL certificates and adds a password.
Save your password:
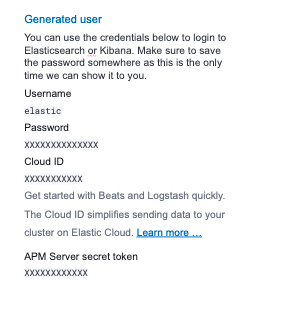
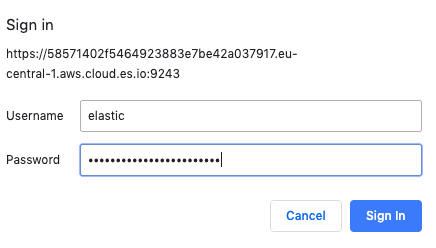
First save pwd=“userid:password”, used for basic authentication, in an environment variable. Then run the curl:
export pwd="elastic:"
curl --user $pwd  -H 'Content-Type: application/json' -XGET https://58571402f5464923883e7be42a037917.eu-central-1.aws.cloud.es.io:9243/_cluster/health?pretty
Here it shows all is good (green) and I that have 2 data nodes.
{
"cluster_name" : "58571402f5464923883e7be42a037917",
"status" : "green",
"timed_out" : false,
"number_of_nodes" : 3,
"number_of_data_nodes" : 2,
"active_primary_shards" : 6,
"active_shards" : 12,
"relocating_shards" : 0,
"initializing_shards" : 0,
"unassigned_shards" : 0,
"delayed_unassigned_shards" : 0,
"number_of_pending_tasks" : 0,
"number_of_in_flight_fetch" : 0,
"task_max_waiting_in_queue_millis" : 0,
"active_shards_percent_as_number" : 100.0
}
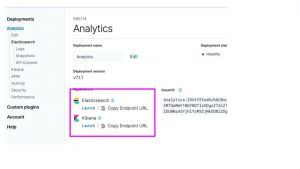
And you can see the cluster status from the main screen https://cloud.elastic.co/deployments.
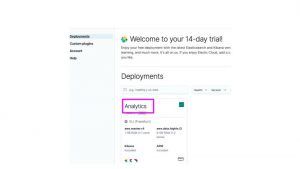
Click on the name you gave the deployment. Here I called mine Analytics.
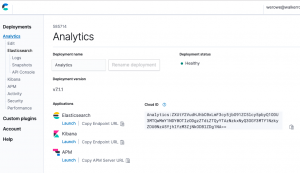
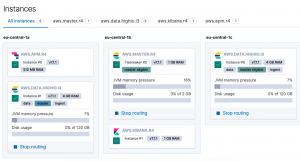
Here you can see that I have 5 VMs. Or they could be running in containers. I am not sure.
There’s not a lot of memory on these nodes. Which, if you have worked with AWS before, makes sense as the larger the machine the higher the subscription fees.
Then in the browser it gives you the same data we extracted using curl above.
{
"name" : "instance-0000000001",
"cluster_name" : "58571402f5464923883e7be42a037917",
"cluster_uuid" : "x4gHtdPbTiiFlcxWkjDJsQ",
"version" : {
"number" : "7.1.1",
"build_flavor" : "default",
"build_type" : "tar",
"build_hash" : "7a013de",
"build_date" : "2019-05-23T14:04:00.380842Z",
"build_snapshot" : false,
"lucene_version" : "8.0.0",
"minimum_wire_compatibility_version" : "6.8.0",
"minimum_index_compatibility_version" : "6.0.0-beta1"
},
"tagline" : "You Know, for Search"
}
Here is that curl again Notice what we have put the userid:password into the environment variable pwd to avoid having to type that each time.
export pwd="elastic:"
curl --user $pwd https://58571402f5464923883e7be42a037917.eu-central-1.aws.cloud.es.io:9243/
Look Some (a lot of Data) Into the Environment
Now, let’s stress this environment and show you how to use it by loading it with the extremely large FDA (American Food and Drug Administration) data on drug reactions. Will we use this later to build a machine learning model to try to prective the side effects of a particular drug.
wget https://download.open.fda.gov/drug/event/all_other/drug-event-0004-of-0004.json.zip
unzip drug-event-0004-of-0004.json.zip
There are 4 datasets you can download. As you can see it is quite large > 1 GB when unzipped. And this is just JSON text.
- -rwxrwxrwx 1 ubuntu ubuntu 33M Jun 4 10:51 drug-event-0001-of-0004.json
- -rwxrwxrwx 1 ubuntu ubuntu 79M Jun 5 10:51 drug-event-0002-of-0004.json
- -rwxrwxrwx 1 ubuntu ubuntu 211M Jun 5 10:52 drug-event-0003-of-0004.json
- -rwxrwxrwx 1 ubuntu ubuntu 637M Jun 4 10:52 drug-event-0004-of-0004.json
We can try to use the bulk loader against this data. But ES complains, saying the JSON file is malformed. Plus files 3 and 4 are larger than 100 MB, which is the maximum size the ES bulk loader will handle:
curl --user $pwd -H 'Content-Type: application/x-ndjson' -XPOST 'https://58571402f5464923883e7be42a037917.eu-central-1.aws.cloud.es.io:9243/0/_bulk?pretty' --data-binary @drug-event-0004-of-0004.json
It will give this error:
{
"error" : {
"root_cause" : [
{
"type" : "json_e_o_f_exception",
"reason" : "Unexpected end-of-input: expected close marker for Object (start marker at [Source: org.elasticsearch.transport.netty4.ByteBufStreamInput@2fd1885a; line: 1, column: 1])\n at [Source: org.elasticsearch.transport.netty4.ByteBufStreamInput@2fd1885a; line: 1, column: 3]"
}
],
Load the Data Using Python
So we can load it the slow way by running this python code below. This program will run slow because it connects to the API one time for each JSON record. It will take days to load it into this instance. But we can load enough of it in a few hours to run some analytics against it, which we will illustrate in subsequent posts.
Change the open statement to pick up the name of the file you downloaded:
open('drug-event-0004-of-0004.json')
And the URL of your instance. Keep /fda/_doc on the end, as fda is the instance we will use and /fda/_doc is the index type.
url = "https://58571402f5464923883e7be42a037917.eu-central-1.aws.cloud.es.io:9243/fda/_doc/"
Here is the code:
import json
import requests
import uuid
def fdict(d):
ky = ['receiptdateformat', 'companynumb', 'transmissiondate', 'fulfillexpeditecriteria', 'serious', 'receivedate', 'safetyreportid', 'receiptdate', 'receivedateformat', 'receiver', 'primarysource', 'transmissiondateformat', 'sender', 'patient']
headers = { 'content-type': 'application/json' }
url = "https://58571402f5464923883e7be42a037917.eu-central-1.aws.cloud.es.io:9243/fda/_doc/"
data={}
for i in ky:
data[i] = d[i]
response = requests.put(url + str(uuid.uuid4()) , headers=headers, json=data, auth=('elastic', '
You can list some of the data like this:
curl --user $pwd -H 'Content-Type: application/json' -XGET https://58571402f5464923883e7be42a037917.eu-central-1.aws.cloud.es.io:9243/fda/?pretty
And list all indices in this cluster to get the document count:
curl --user $pwd -XGET https://58571402f5464923883e7be42a037917.eu-central-1.aws.cloud.es.io:9243/_cat/indices?v
As you can see, the data is large. 47,939 documents is 1.9 GB of storage.
health status index        uuid                   pri rep docs.count docs.deleted store.size pri.store.size
green  open   fda     DRQnRqnmQsaRcsxHVIT1pg   1   1      47939            0      1.9gb       1003.6mb
Kibana
Now let’s look at the same data with Kibana. Click on the Kibana link from the main screen. In our case it is https://78f7165792d54709b8ec37f3d80ed854.eu-central-1.aws.cloud.es.io:9243/app/kibana
If you’re new to Kibana you have to create an Index Pattern before you look at any of the data. which you will do using the Discover screen.
The Index Pattern is the name of the index, in this case fda, or a wildcard that matches the index name, like fda*.
You click the discover button in Kibana to see this.
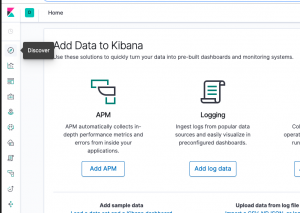
When you first open Kibana you create the first Index Pattern. ElasticSearch will parse the JSON documents it finds there and show you the schema it found. The schema is the Index Pattern.
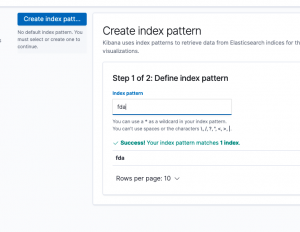
Kibana will churn for a few seconds and then show you the fields it has auto discovered.
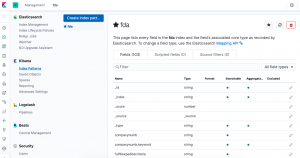
Below it shows the first few records. Below we click on one record to expand it.
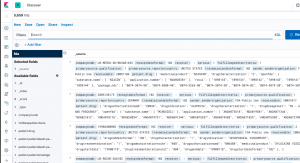
Each JSON record from the FDA is enormous. A small part looks like this:

From here you could connect logstash to it, to ingest some application or hardware logs. We will explain that and how to use analytics in subsequent posts.
These postings are my own and do not necessarily represent BMC's position, strategies, or opinion.
See an error or have a suggestion? Please let us know by emailing blogs@bmc.com.


