There are many types of logs in Amazon Web Services (AWS), and the more applications and services you run in AWS, the more complex your logging needs are bound to be. Logs originate from two primary sources—applications running on AWS services, and the AWS services themselves. An AWS centralized logging solution, therefore, becomes essential to manage this complexity. To achieve this kind of end-to-end visibility requires a conscious effort to centralize all the disparate logging data irrespective of their source of origin. AWS provides CloudWatch to centralize this data. CloudWatch is the primary collector that collects logs from different AWS services such as Amazon VPC Flow Logs, Route 53 Logs, Lambda Logs, CloudTrail Logs, and so on, in addition to log data from applications like Nginx or Apache system that you may be using in your AWS deployment.
Once collected in CloudWatch, you can use the BMC Helix Log Analytics solution to monitor and analyze logs and set up alerts. Doing this, you can get the native benefit of AWS log collection and the analytical power of the machine learning (ML)-powered observability platform provided by BMC. The ability to collect logs from CloudWatch allows you to aggregate all your log data combined with data from other sources across hybrid and multi-cloud environments. BMC Helix Log Analytics provides advanced monitoring and alerting capabilities to derive meaningful insights from logs, such as filtering by log metadata; enriching logs to add meaningful context; customizing alert messaging; automated alerting with ML-assisted anomaly detection; and service monitoring with BMC Helix Operations Management with artificial intelligence for IT operations (AIOps).
Centralized AWS logging with BMC Helix Log Analytics
The following diagram shows logs being collected from different applications and services across different AWS regions. CloudWatch collects logs by defining log streams and log groups for each region. A log stream is a sequence of log events coming from the application instance or resource being monitored. For example, a log stream may be associated with an Apache access log on a specific host. Log groups define groups of log streams that share the same retention, monitoring, and access control settings. One or more log streams belong to a log group. If you have a separate log stream for the Apache access logs from each host, you could group those log streams into a single log group called MyWebsite.com/Apache/access log.
Logs are aggregated in CloudWatch, and then collected and stored in BMC Helix Log Analytics for further analysis.
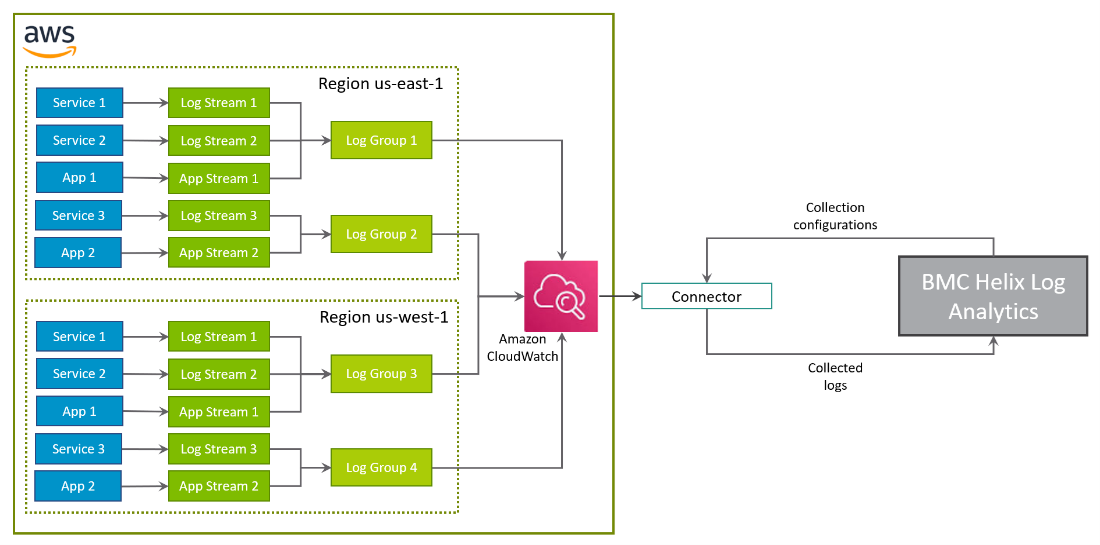
Figure 1. Collecting logs from AWS deployment
Collecting logs
BMC Helix Log Analytics uses a log collection policy to collect logs from AWS CloudWatch. To configure the collection policy, you must provide credentials to access the AWS account that contains the logs to be collected. Next, you would need to download and install the connector on the AWS platform to collect application or services logs for monitoring.
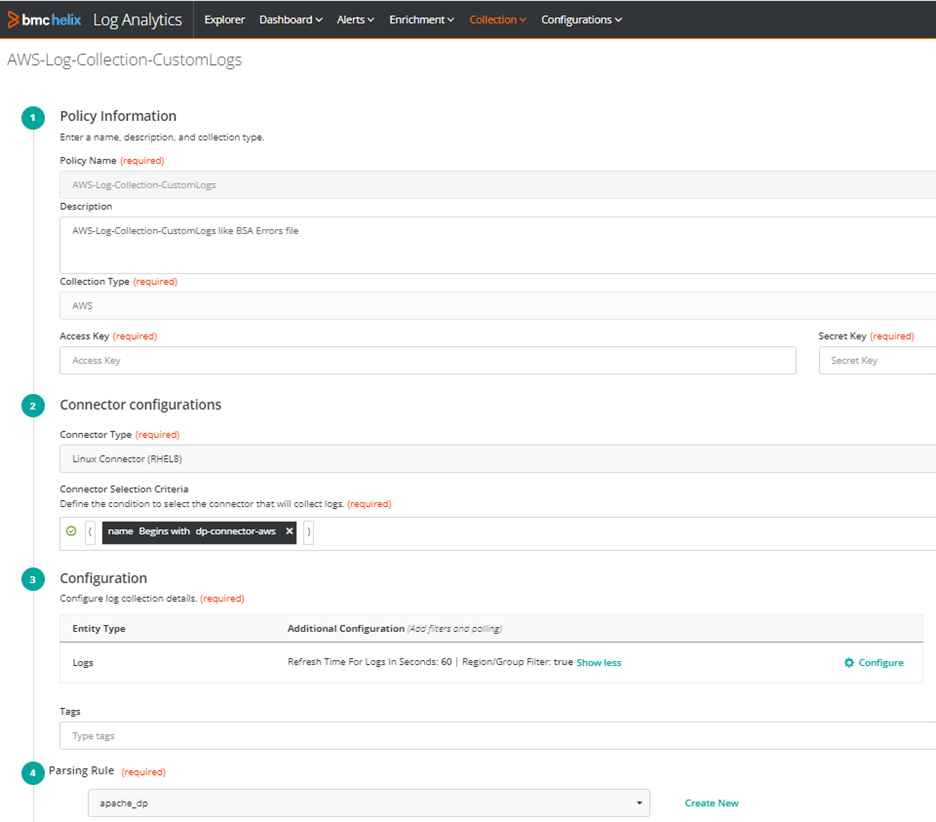
Figure 2: Log policy for collecting AWS logs
You may configure the refresh time and provide details of the region, log groups, and log streams for the logs to be collected.
You can also specify the application format to parse logs and provide log filters to include or exclude specific data. Log parsing helps to convert unstructured raw logs into meaningful key-value pairs and make them ready for analysis. It also enables you to get statistics on log message parameter values, conduct faceted searches, and filter logs by specific fields and values.
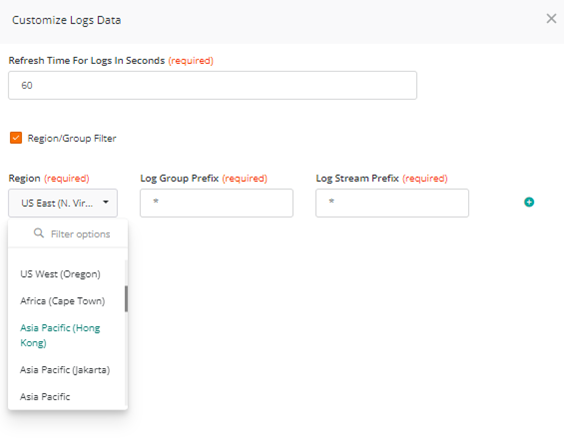
Figure 3: Configure AWS logging
Once the configuration is done, you can see the health status of the log connector and policy configured to ensure there is no error with log collection. Then you can start to analyze logs in Explorer and create alerts and other policies as appropriate.
Monitoring logs
Once the logs are collected and stored, you can further analyze them in the log explorer to search, discover, or query any log record. Insights from logging can provide a great deal of context around the behavior of your applications and services and help you troubleshoot when you are dealing with an outage.
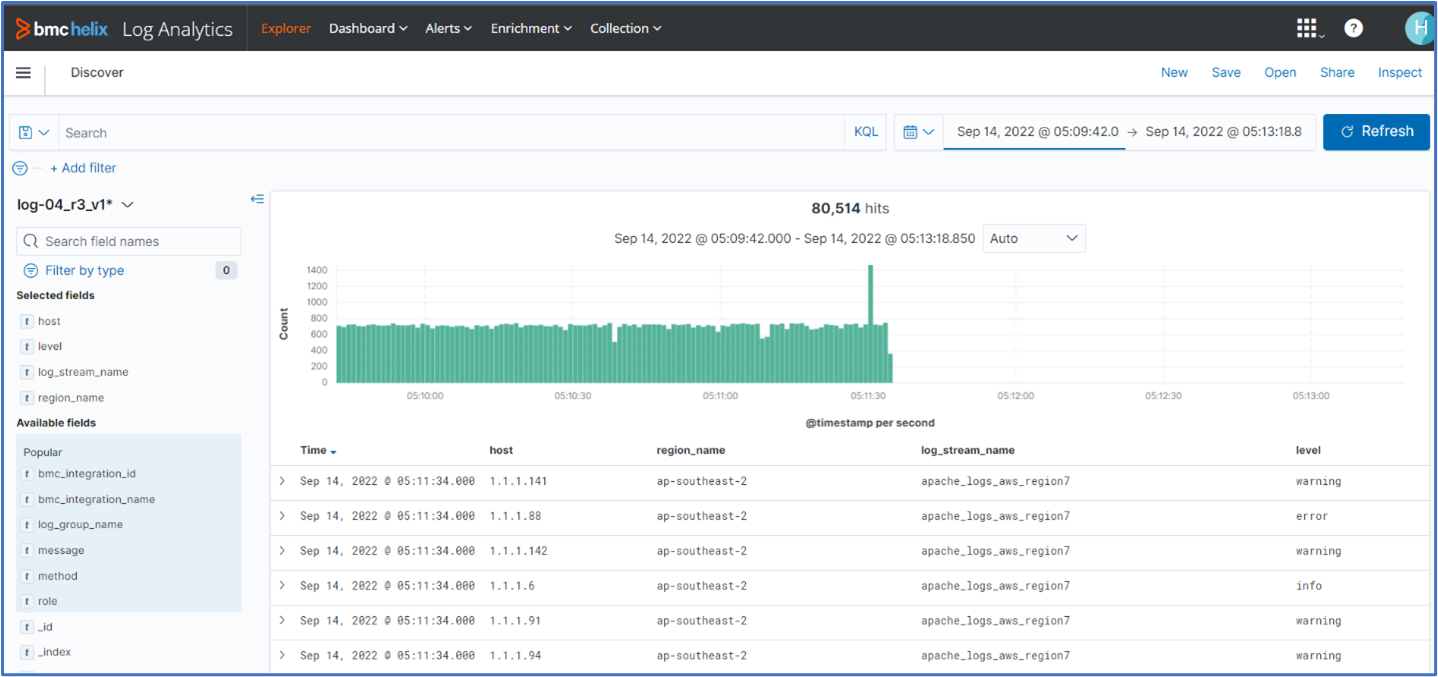
Figure 4. Discover and search logs in log explorer
You can slice and dice a given log record to see detailed attributes and values, which helps you understand and further troubleshoot your issue.
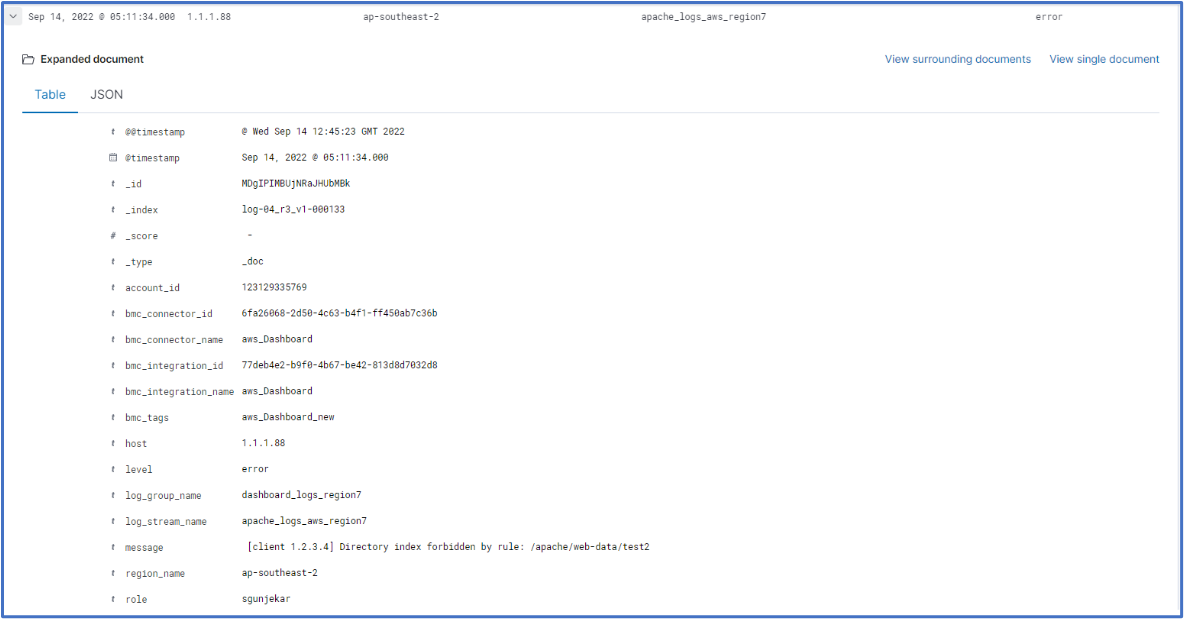
Figure 5. Anatomy of AWS log record
Creating alerts
When things go wrong, alerts are essential for reducing response and recovery times. BMC Helix Log Analytics offers the ability to set alarms or alerts on any given condition occurring in the logs. Log events generated from these alerts can be operated in BMC Helix Operations Management, which takes proactive actions and sends notifications to you.

Figure 6. Log alert policies

Figure 7. Analyzing log events in the BMC Helix Operations Management console
Visualizing logs
Dashboards help you track the most important metrics so you are always aware of the state of the system. You can create dashboards to monitor metrics derived from your logs, and visualize the data in the form of a line chart, a stacked chart, or a numerical metric. Taking things further, you can add alarms to widgets for quick and simple monitoring. BMC Helix Log Analytics uses BMC Helix Dashboards to provide out-of-the-box log dashboards that allow you to create self-service dashboards as needed. Here is a self-service dashboard to monitor and visualize logs from an AWS deployment.
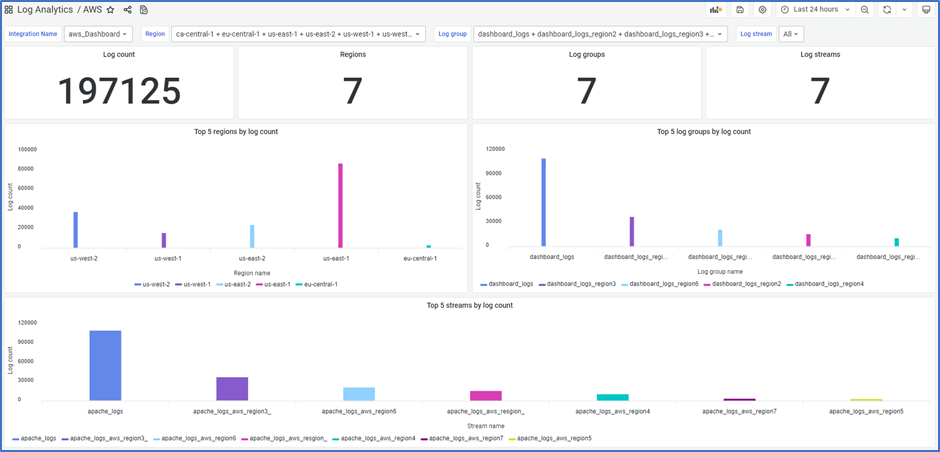
Figure 8. Self-service AWS log monitoring dashboard
BMC Helix Log Analytics is a great way to manage AWS observability with log monitoring. It acts as an advanced log monitoring solution to collect logs from AWS CloudWatch, perform monitoring and alerting, and deliver meaningful insights to improve and optimize your application. When used with monitoring metrics data from AWS and BMC Helix Operations Management with AIOps, it provides fully contextualized data about the state of your AWS services and the applications running in it.
The BMC Helix platform is an integral part of the BMC observability solution, giving SREs, DevOps engineers, and developers a seamless and streamlined workflow for IT monitoring, troubleshooting, and investigation to easily move from problem detection to resolution in minutes.
To find out more about log collection from AWS, check out our BMC Helix Log Analytics product documentation and video.
To learn more about BMC Helix Log Analytics capabilities, watch our overview video or refer to our product documentation.


![Blue purple gradient charts and screens_1400x700[2]](https://s7280.pcdn.co/wp-content/uploads/2022/04/Blue-purple-gradient-charts-and-screens_1400x7002-145x100.png)
