
Optimizing application performance takes a significant amount of work behind the scenes—from quickly resolving and proactively preventing issues to understanding what could be causing bottlenecks and latency to making sure the large language models (LLMs) in generative AI (GenAI) applications are performant and optimized – to managing containerized software.
The latest BMC Helix 25.2 ITOM release helps IT teams optimize application performance, resolve issues faster, and more easily manage containerized software with the following new AI agents and capabilities:
- BMC HelixGPT Post Mortem Analyzer—Get a detailed review after an incident occurs that documents root cause, impact, and actions taken to resolve it so that you can prevent it from reoccurring.
- BMC HelixGPT Insight Finder—Use a natural language chat interface to instantly create dashboards that monitor issues impacting service health. Check to see whether an issue is being worked on, see what the timeline for fixing it is, and find out its root cause.
- Application observability with Open Telemetry logs—Improve the diagnosis of application performance issues by correlating traces with span logs to enhance root cause isolation.
- LLM observability—Improve LLM model quality and efficacy with a dashboard that provides insights on model accuracy, optimize LLM application performance and model training costs with a dashboard that provides metrics including resource utilization, and request processing performance.
- Deep-container discovery—More easily manage licenses and security patches for containerized software with new discovery capabilities that show you which software is running in your containers.
BMC HelixGPT Post Mortem Analyzer provides in-depth insights after incidents
After an incident occurs, site reliability engineers (SREs) often need to spend additional days or weeks dissecting issues to gain insights into why they occurred, how they impacted operations, and most importantly, how to prevent them in the future. BMC HelixGPT Post Mortem Analyzer saves SREs time by providing insights into the root cause, its impact on operations, and proactive measures to prevent them from happening in the future.
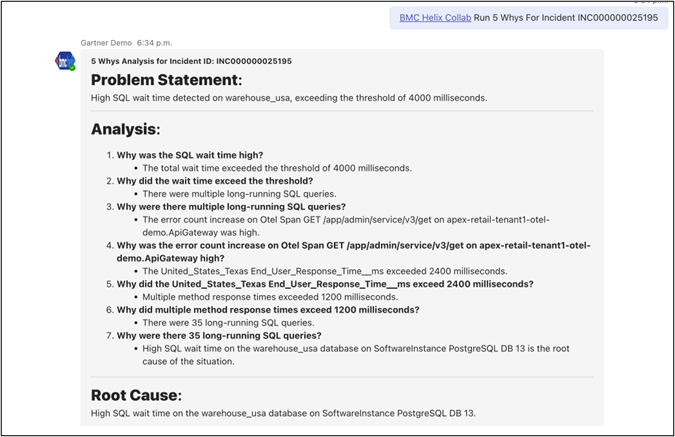
Figure 1. BMC HelixGPT Post Mortem Analyzer.
BMC HelixGPT Insight Finder automatically creates custom dashboards by chat
Tracking the status of issues can be difficult and complex—such as knowing what the timeline is for fixing them, understanding their underlying root causes, and comprehending how they’re impacting service health. It usually takes in-depth research and an examination of multiple data sources to find the answers to these questions, and development teams to build customized dashboards with this information. BMC HelixGPT Insight Finder automatically creates visualizations and reports for easy sharing, without the need to know any query language.
With BMC HelixGPT Insight Finder, IT teams can use a natural language chat interface to ask questions such as how many incidents there currently are, how many closed events have occurred in a given period, grouped by severity, and get historical data such as how often an issue has occurred in the past.
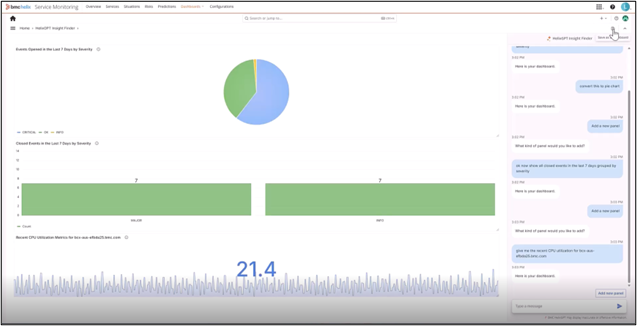
Figure 2. BMC Helix GPT Insight Finder.
Application observability with Open Telemetry logs helps improve application performance
It’s important to analyze application performance to make sure that there are no bottlenecks, and to give end users of applications a responsive and glitch-free experience.
BMC Helix has expanded its Open Telemetry data ingestion capabilities from traces to include log span trace data. By correlating span log data with traces, BMC Helix captures latency, response time, duration, and error rate to enhance root cause isolation of application performance issues.
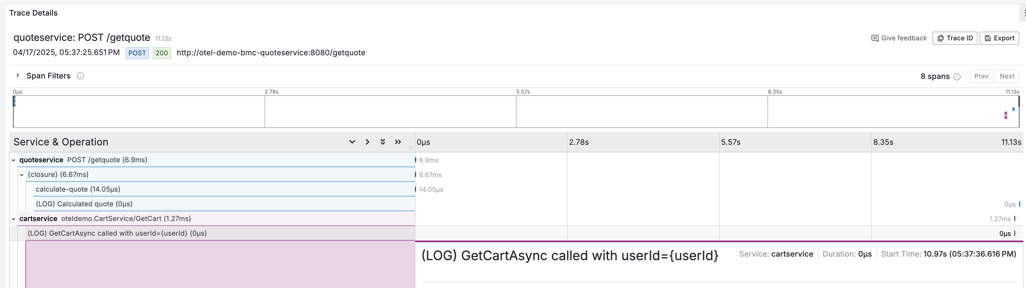
Figure 3. BMC Helix application observability with Open Telemetry logs
LLM observability helps improve LLM application efficiency, quality and accuracy
LLM applications require an exponentially higher amount of compute power and consume more energy than traditional applications, so it’s important to optimize performance and costs. Additionally, measuring the efficacy and quality of LLM models ensures model accuracy and reliability to produce valid responses for application users and reduce AI hallucinations.
BMC Helix’s new LLM observability functionality provides LLM application workflow tracing and dashboards to help data scientists and AI engineers monitor model quality and efficacy while enabling IT and developers to better understand LLM application performance and behavior.
BMC Helix displays LLM training metrics that help improve LLM model accuracy, detect drift, and measure and reduce hallucinations. Key signals that the BMC Helix LLM observability dashboards reveal include success rate of generative AI (GenAI_ requests, LLM request rate, query processing rate and efficacy, and LLM latency. The BMC Helix dashboard is configurable and allows new LLM training metrics to be added as needed.
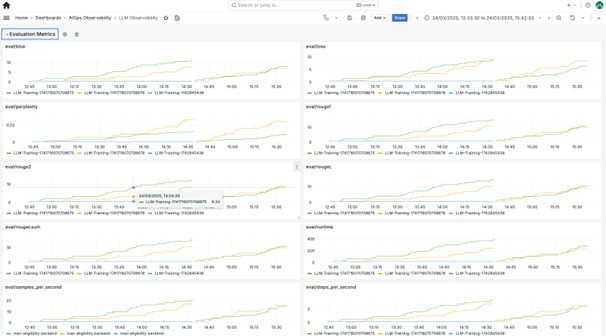
Figure 4. LLM model quality and evaluation metrics dashboard.
BMC Helix LLM Observability also helps track resource utilization to optimize costs by measuring token usage and how much GPU processing power was utilized to train an LLM model with metrics like power usage, memory, and temperature.
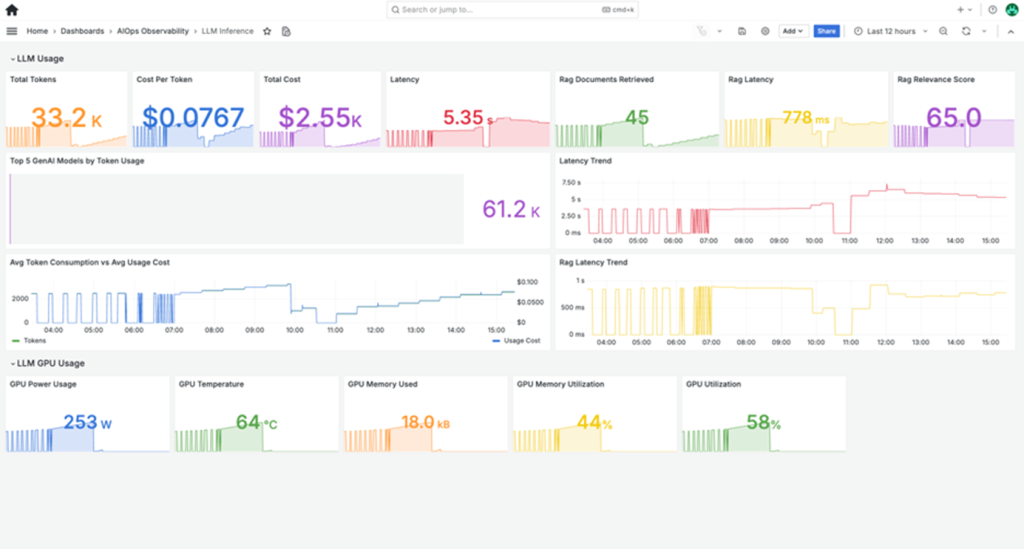
Figure 5. LLM GPU utilization and cost dashboard.
Deep container discovery provides visibility to manage containerized software
While containerized deployments bring efficiency to application development, it’s difficult to keep track of software versions running in containers.
BMC Helix Discovery now provides visibility into software running in deployed containers by extending ssh-based worker node scans into containers and using existing discovery patterns to discover containerized software details.
This visibility helps you manage containerized software licenses and to stay up to date with security patches while giving you visibility into the overall containerized software lifecycle.
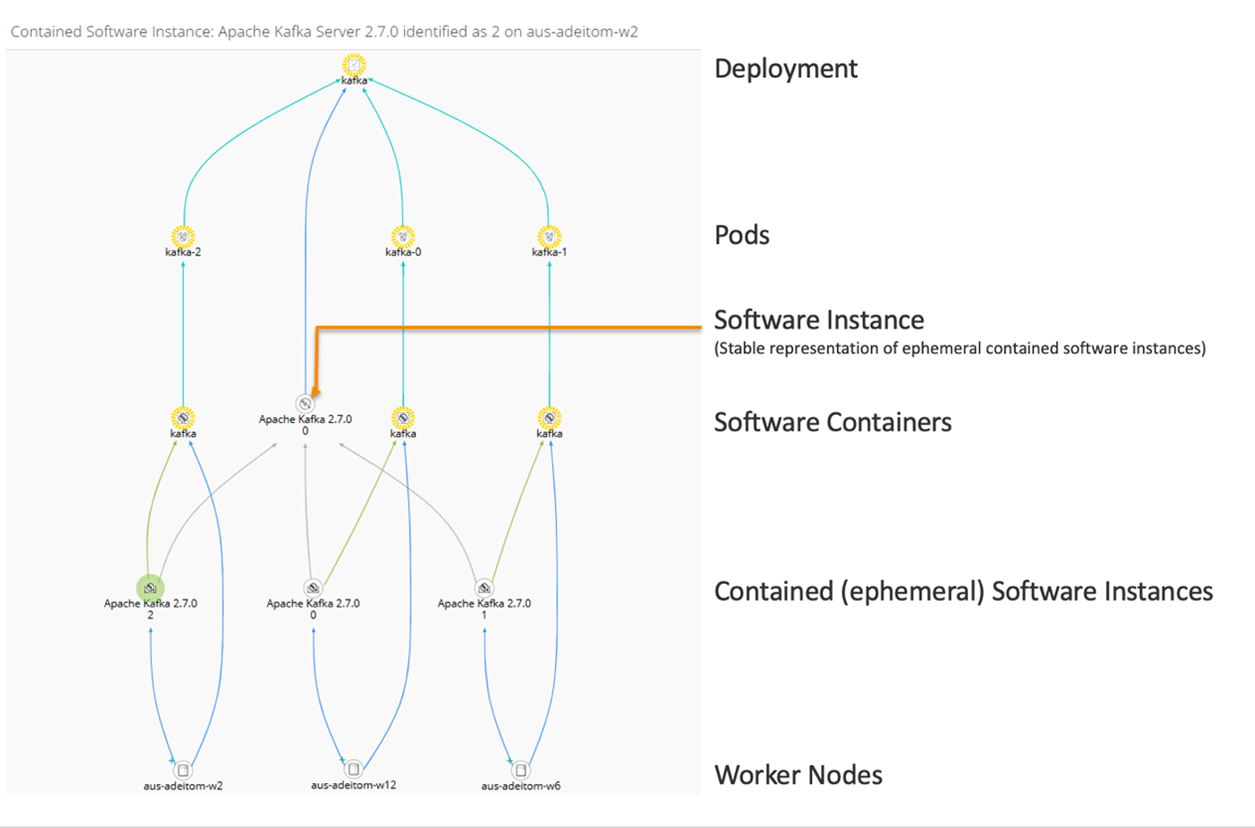
Figure 6. BMC Helix container discovery diagram.
New automated capacity reporting simplifies report creation and distribution
Now with BMC Helix Dashboards, you can automate the creation, distribution, and archiving of capacity reports:
- Build a customized capacity reporting template in BMC Helix Dashboards.
- Manage basic and advanced reports in one place and create user access controls for retrieving archived reports.
- Easily manage and update the email distribution list with the ability to add, delete, or edit individual emails and grant them access to archived reports.
To learn more about how these new BMC Helix capabilities can help you transform your IT operations, contact us for a consultation.