
This tutorials shows you how to use the lag function to calculate moving averages in Snowflake.
It builds upon work we shared in Snowflake SQL Aggregate Functions & Table Joins and Snowflake Window Functions: Partition By and Order By.
(This article is part of our Snowflake Guide. Use the right-hand menu to navigate.)
Using lag to calculate a moving average
We can use the lag() function to calculate a moving average. We use the moving average when we want to spot trends or to reduce the volatility from the daily number as it can vary widely.
In other words, it’s better to look at a week of sales versus one day to see how a product is performing.
Create sample data
To study this, first create these two tables.
CREATE TABLE customers
  (
     customernumber     varchar(100) PRIMARY KEY,
    customername varchar(50),
    phonenumber varchar(50),
    postalcode varchar(50),
    locale varchar(10),
    datecreated date,
    email varchar(50)
  );


CREATE TABLE orders
  (
     customernumber     varchar(100) PRIMARY KEY,
    ordernumber varchar(100),
    comments varchar(200),
    orderdate date,
    ordertype varchar(10),
    shipdate date,
discount number,
quantity int,
    productnumber varchar(50)
)
Then paste in this SQL data. The top of the data looks like this:
insert into customers (customernumber,customername,phonenumber,postalcode,locale,datecreated,email) values ('440','tiqthogsjwsedifisiir','3077854','vdew','','2020-09-27','twtp@entt.com');

insert into orders (customernumber,ordernumber,comments,orderdate,ordertype,shipdate,discount,quantity,productnumber) values ('440','402','swgstdhmju','2020-09-27','sale','2020-10-01','0.7005950240358919','61','BB111');

insert into customers (customernumber,customername,phonenumber,postalcode,locale,datecreated,email) values ('802','hrdngzutwelfhgwcyznt','1606845','rnmk','','2020-09-27','ympv@zfze.com');

insert into orders (customernumber,ordernumber,comments,orderdate,ordertype,shipdate,discount,quantity,productnumber) values ('802','829','jybwzvoyzb','2020-09-27','sale','2020-10-06','0.3702248922841853','75','FF4444');

insert into customers (customernumber,customername,phonenumber,postalcode,locale,datecreated,email) values ('199','ogvaevvhhqtjcqggafnv','8452159','hyxm','','2020-09-27','znqo@rftp.com');
Write SQL statement
Now we want to calculate the moving average total sales over the previous four days.
Here, we have a select statement inside a select statement because we want one order total per day. Then the lag statement looks over that one record to look at the previous day.
select  shipdate, (quantity + lag(quantity,1) over (order by shipdate) +
lag(quantity,2) over (order by shipdate) +
lag(quantity,3)over (order by shipdate) + lag(quantity,4)
over (order by shipdate)) / 5  as movingaverage from

(select shipdate, sum(quantity) as quantity from orders group by shipdate);
Here is the moving average. The first rows are null as the lag function looks back further that the window for rows that don’t exist.
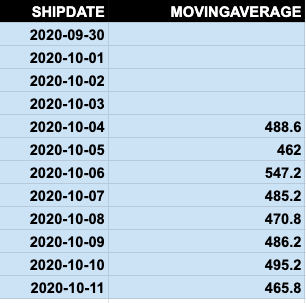
We can prove that this calculation is correct, by calculating this another way.
Let’s sum orders by ship date.
select  shipdate, sum(quantity)
from orders group by shipdate
order by shipdate;
Then we copy the results into a spreadsheet:
- On the left is the windows function.
- On the right is the query above.
I have added a column using the spreadsheet function average() to show that the numbers are the same. So, you can easily see how the windows lag function works.
windows function	sum and group by	=AVERAGE(E3:E7)
SHIPDATE	MOVINGAVERAGE	SHIPDATE	SUM(QUANTITY)	moving average
2020-09-30		2020-09-30	427
2020-10-01		2020-10-01	230
2020-10-02		2020-10-02	657
2020-10-03		2020-10-03	604
2020-10-04	488.6	2020-10-04	525	488.6
2020-10-05	462	2020-10-05	294	462
2020-10-06	547.2	2020-10-06	656	547.2
2020-10-07	485.2	2020-10-07	347	485.2
2020-10-08	470.8	2020-10-08	532	470.8
2020-10-09	486.2	2020-10-09	602	486.2
2020-10-10	495.2	2020-10-10	339	495.2
2020-10-11	465.8	2020-10-11	509	465.8
Additional resources
For more tutorials like this, explore these resources: