
In my first post on observability platforms, I discussed the definition and components of observability. The post below goes into detail on how to create a successful system that maximizes the investment you make in your observability platform.
Discover the environment
Understanding the deployed infrastructure and communication between different observability platform components enables the grouping of resources into services or applications. This provides a sound basis for analysing business impact, highlighting the effect one resource may have on another and the service overall.
Initial and deep scans by specialised tools can discover and map an environment, which is critical to understanding what aspects are being used and how the various components are linked together. In today’s dynamic environments, changes often happen far more frequently than would be picked up by scans alone. For example, changes in the topology of an application that scales up automatically to meet a peak demand for a couple of hours and then scales back down might be missed by a scheduled, scan-based system. Discovered business services should be updated or enhanced with structures found by platform monitoring or from information gathered from application performance monitoring (APM) tools. These different sources need to be used together to provide a complete, up to date, and coherent picture of the environment. It is only then, that, if issues occur with those ephemeral additional elements, they can be appropriately dealt with in a timely manner.
Intelligent observability platforms need a scheduled baseline understanding of the environment, which is continuously kept up to date with changes.
Normalization and consolidation
As discussed in part one, observability platforms should consume, process, and analyse metrics, logs, and traces to get an accurate view of the business services. The ability to consolidate all of this information into a single observability platform provides significant value and should not be underestimated. Various components may provide overlapping data, necessitating decisions about how to use or merge information.
Metric data consumed into the platform via integrations or APIs needs to be treated in the same way as time series data natively generated by the platform itself. The path through processing that is done by the platform automatically or based on configured policies should be identical, regardless of data source. The platform needs to manage any additional attributes that are required and provide the ability to cross-launch back to the original data source, where appropriate, for drill down. There will always be more detail and context available in the source tool; it needs to be quick and simple to get to that additional information.
In a similar way, events consumed into the platform should be normalised to a standard but extensible format. Events entering the platform should flow through the same stages of suppression, de-duplication, enrichment, and correlation as if they were events generated within the platform. Importantly, any step could include events from multiple sources (e.g., correlate events from three different tools) and any insights that can be gained from events should be added to the datastore regardless of where the event originated.
Intelligent observability platforms normalize disparate data into a single, easy-to-consume, consolidated view and provide automated analysis of this information.
Situations and anomalies
Learning normal behaviour so that only abnormalities trigger automatic alerts during normal operations significantly reduces both the noise generated by the observability platform and the overhead of managing thresholds on all metrics. Until recently, analysis of each metric has been performed in isolation to highlight unusual behaviour. We now have the algorithms and processing power to analyse groups of metrics together in near real-time to see the “combined” abnormality.
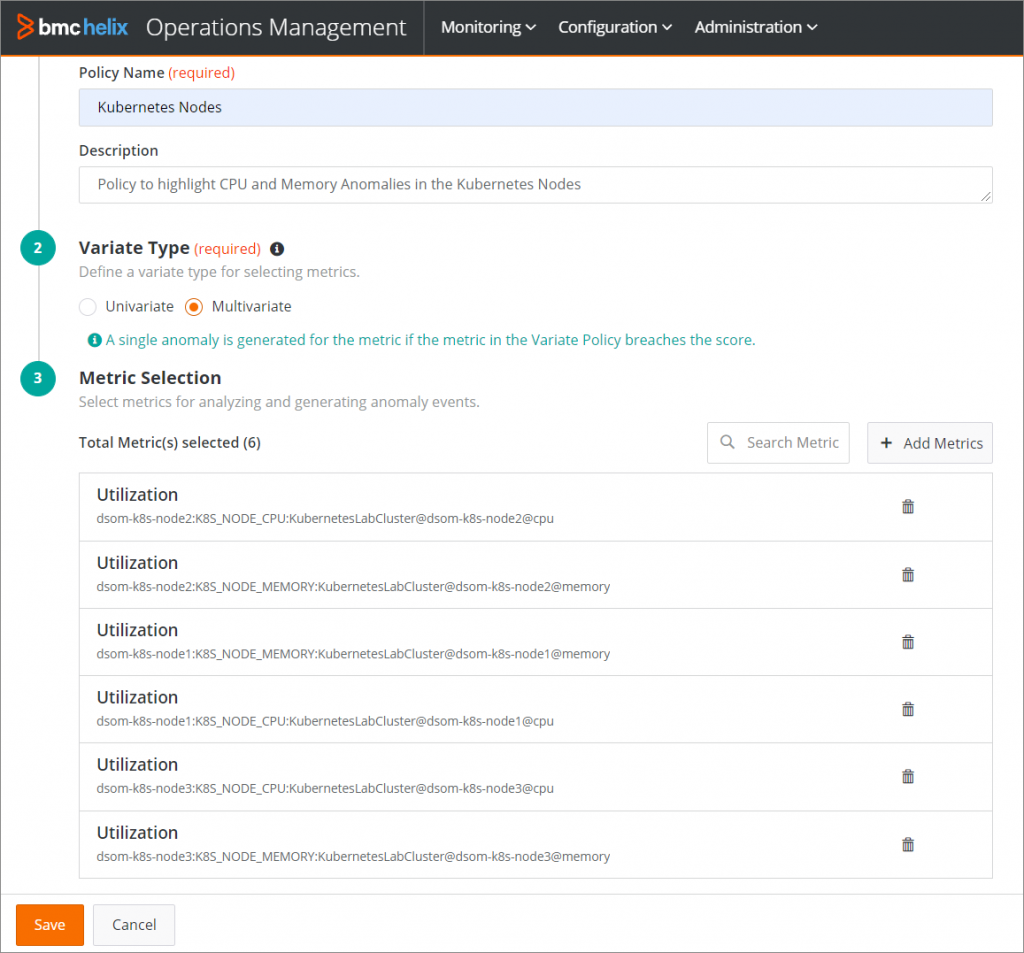
Defining a policy to look at combined abnormalities of multiple metrics
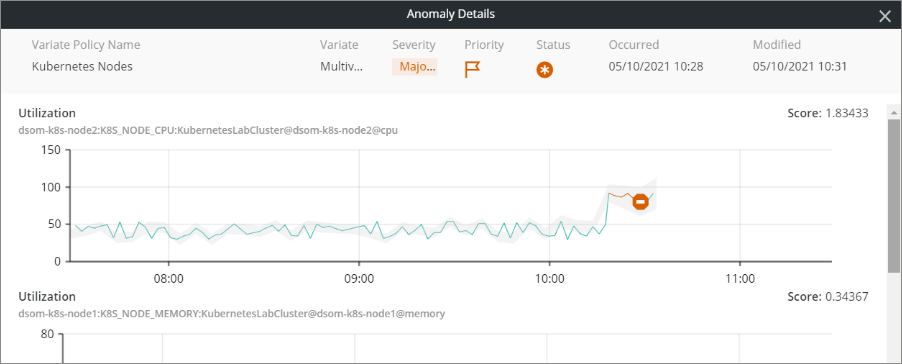
Combined anomaly identified, shows graphical representation and score for each metric
When a multi-variate abnormality event is created, a view of the relative abnormality of each considered metric is important. You can understand which of the metrics have contributed the highest score to the calculated rating, which will also help in the triage process.
On the flip side, I personally still see the need for absolute limits on certain metrics. A filesystem or database that is slowly filling up will eventually cause a problem. If we are just looking for deviations from the norm over a given period, then a slowly creeping metric would be missed.
Learning behaviour should not be restricted to metrics. Events and log entries can also have a normal pattern or frequency. It could be that the volume of entries written to a log has suddenly changed or the content of the log messages or event text is somehow different.
Automatically correlate multiple events into situations
Using an inherent understanding of technology (virtual environments, container platforms, databases, etc.) and the detailed understanding of the components that make up a business service, an intelligent observability platform can automatically correlate multiple events. This should be done without compromising or losing the detail in each underlying event. These situations are generated automatically without the need to build specific rules or policies. It will reduce the event noise presented to the operations teams and provide focus to resolving the multiple related events.
Again, I personally believe not everything can be achieved through machine learning alone, at least not currently. There is almost certainly a need for some defined rules as well. There are certain log messages or events that require definitive action. For example, a power supply failure would not be picked up by learnt behaviour, so rules must be in place to handle these kinds of events.
Intelligent observability platforms need to combine automated analysis, including learnt behaviour, for metrics, events, and logs seamlessly with defined rules to ensure all scenarios are covered.
Low-code rules
Rules created should be defined as a simple workflow that does not require the individual to have any understanding of traditional coding. The rules we define in our intelligent observability platform need to enhance the base features plus utilise any existing analysis to achieve the end goal. In a similar way to completing a form using multiple choice answers, low-code rules lead to fewer errors and more correct logic. Performing as much validation as possible at the point of definition guides the creation of the process flow and policies in a structured way. This makes the platform implementation quicker and maintenance easier as there is a defined structure in place that everyone follows.
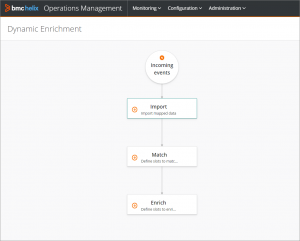
Define rules with graphical drag and drop interface
Intelligent observability platforms provide flexible mechanisms for defining rules using drag-and-drop type interfaces, while guiding the analyst/developer to create valid and logical flows.
Understand failure
Once the observability platform has processed all of the data, as we have already discussed, we now need it to understand the failure or multiple failures to help us resolve the problem and return the service to a normal operating state. Intelligent observability platforms visualize the status of business services based on the situations and validated events, which have been generated from the vast number of metrics, events, and logs available.
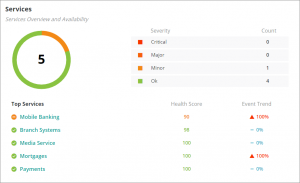
Service status visualized based on validated events
Having associated all of the validated events with the components in the service model, the observability platform can also then provide automated analysis of the underlying cause of an issue. Using the knowledge of the components that are currently in use for the service and the impact relationships between them, it can automatically identify the probable cause of the service issue.
Automation
There is significant automation in the areas we have already covered to get to the point where we have reduced noise and identified something that needs action. Where possible, we want to either automate the resolution with an existing configured automation or request the creation of automation to solve this and be stored as a reusable asset for similar situations in the future.
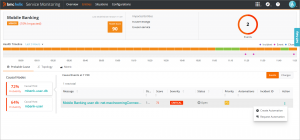
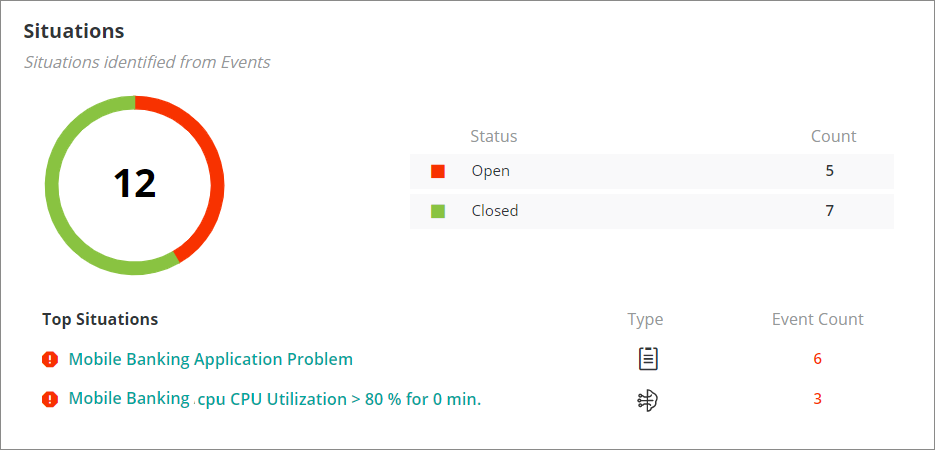
Identify root cause and automate resolution
In the example above, the mobile banking service is failing, and the probable cause based on the data and events received is the highlighted event, indicating that the maximum configured number of connections has been reached for the database. Now that we know the root cause, we can easily resolve the problem by increasing the configured number of connections to the database. Although a simple change like this can be done manually, it is preferable to consider automation to remove potential human error, ensure there is an audit trail, speed resolution, and enforce change implementation within defined policies.
If an existing automation is not currently available to resolve the issue, it should be possible to log a request for new automation to resolve the current and subsequent similar issues.
There is a wide range of automation tools already in use in enterprises. Integration to these existing tools is imperative so that organizations can utilize existing investments and any already defined automation tasks. Similar to providing a manager of managers capability for the inputs to the observability platform, it must also be able to orchestrate automation of many “worker” tools as the output.
For specific issues with prescriptive resolutions, full automation for recovery is entirely possible. I would argue that there is equal if not more immediately achievable benefit from using automation to gather additional triage information. Even simple automation tasks that restart components are beneficial. Even if they do not fix the problem, the attempt is necessary and can also provide additional background information about the situation.
Intelligent observability platforms use the insight produced to automate resolution or at least speed the time to repair, utilizing any existing automation where possible.
Notification
DevOps needs timely notification of the status of the services being observed and the current progress through resolution including raising incidents to service management.
End users need to be informed about the status of the service. A big part of that is notifying them that operations is aware of an issue and is resolving it.
It is important that the intelligent observability platform notifies stakeholders with appropriate information.
Summary
In my opinion, an intelligent observability platform is not just about using artificial intelligence (AI)/machine learning (ML) to analyse data and come up with a silver bullet to solve any issue. That would be amazing but is not currently realistic. In fact, if technology could do that, then we would not experience any issues at all! A comprehensive platform is very much about breadth and depth of coverage, including consuming information in real time from multiple sources. Taking that information, processing it with a combination of AI/ML and defined rules or policies, all working in combination towards reducing noise, highlighting issues, and indicating where resources should be focused to resolve those issues, should be the goal. Automation can then be used as a first line of resolution or for gathering additional intelligence about an issue.
For those interested in seeing this in action you should investigate BMC Helix Operations Management with AIOps and BMC Helix Discovery.
These postings are my own and do not necessarily represent BMC's position, strategies, or opinion.
See an error or have a suggestion? Please let us know by emailing blogs@bmc.com.