Monitoring Microservices with Spring Boot Actuator and AspectJ

What makes modern applications so different? Modern applications adhere to several essential architectural tenets: They are cloud-native, containerized, auto-scalable, microservice-based, and multi-tenant and supported by DevOps-driven deployment automation. At BMC, our application development environment solution comprises 100-plus microservices running on a containerized cloud platform (AWS), scaled using the Kubernetes platform.
Each microservice can be deployed as Kubernetes Pods (from three to 16 depending on horizontal scaling and replication requirements) spanning multiple availability zones (AZ). The services expose representational state transfer (REST) interfaces for external consumption and remote procedure calls (gRPC) for internal microservice-level communication. As more services are introduced, monitoring and managing modern applications becomes increasingly challenging.
Adopting appropriate agile and DevOps practices is critical to successfully running enterprise-class solutions on a software-as-a-service (SaaS) model and keeping deployments highly available and responsive. BMC has adopted SRE practices to keep our solutions up and running 24x7. For self-observability of stacks, our SRE team uses our in-house monitoring solution. When it comes to self-observability, SRE and development teams require a lot of metrics to keep an eye on the health of the overall stack. Examples of data we monitor include:
For microservices built using the Spring Boot framework, you can enable the Spring Boot Actuator to provide many different types of metrics. For example, the Actuator exposes resource utilization metrics such as CPU and memory utilization; network and disk space utilization; and more. It also exposes other standard Java Management Extensions (JMX) metrics, including garbage collection (GC) overhead, GC time, heap utilization, thread usage/blocked threads, etc. But standard data points are not enough. Depending on the responsibility of a given microservice, you might need additional custom metrics, such as:
For both SRE and development teams, capturing telemetry is the key to seeing what’s going on inside an application. You need to build a telemetry infrastructure to capture and process the data. The two main functions of a telemetry processing infrastructure are:
Below is a high-level diagram of the telemetry pipeline. For our purposes here, we will focus on how to expose standard and custom metrics for microservices built using the Spring Boot framework.
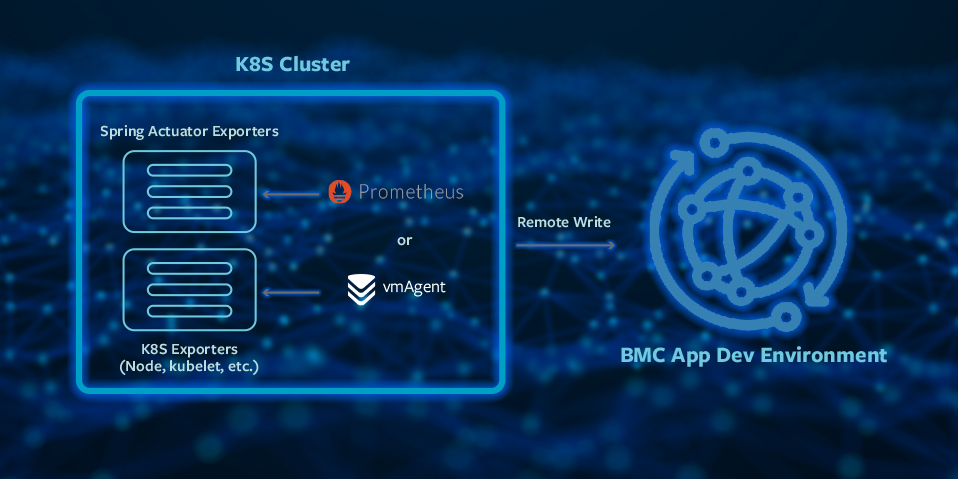
The Actuator is a sub-project within the Spring Boot framework that provides production-ready features to help monitor and manage running applications built using Spring Boot. Telemetry data is exposed by the Actuator via endpoints, which in turn are exposed through HTTP or JMX. You can enable the Spring Boot Actuator by simply adding a spring-boot-actuator dependency in the package manager, as follows:
<dependencies>

<dependency>

<groupId>org.springframework.boot</groupId>

<artifactId>spring-boot-starter-actuator</artifactId>

</dependency>

</dependencies>
Doing so will generate /actuator URLs with various endpoints. Here are a few we found that are relevant for using in our application:
We are specifically interested in the /actuator/metrics endpoint, which returns useful services telemetry data like jvm.gc.live.data.size, jvm.gc.max.data.size, jvm.gc.memory.allocated, jvm.memory.max, jvm.threads.live, jvm.threads.peak, process.cpu.usage, process.files.max, etc.
Since the release of Spring Boot 2.0, metrics are managed by Micrometer support, where you interact directly with Micrometer. As there is an autoconfigured bean of type MeterRegistry, this occurs as an automatic default.
To expose application or service-specific telemetry, you need to define custom metrics using the Actuator framework. This involves accessing MeterRegistry via constructor and then using various meters to capture the telemetry. Micrometer supports various meter types (e.g., counter, gauge, time, and LongTaskTimer). It also provides a dimensional approach that lets you add additional tags like customer, region, etc., to the metrics to build a Time Series for each metric you’re capturing. This allows for the aggregation of metrics as well as drilling down as needed. The disadvantage is that the business logic inside the service gets tangled up with the telemetry code.
Instead of modifying the business logic of each microservice, we instead take advantage of the Aspect-oriented programming (AOP) approach supported by the Spring Boot framework, which allows us to treat telemetry as a cross-cutting concern.
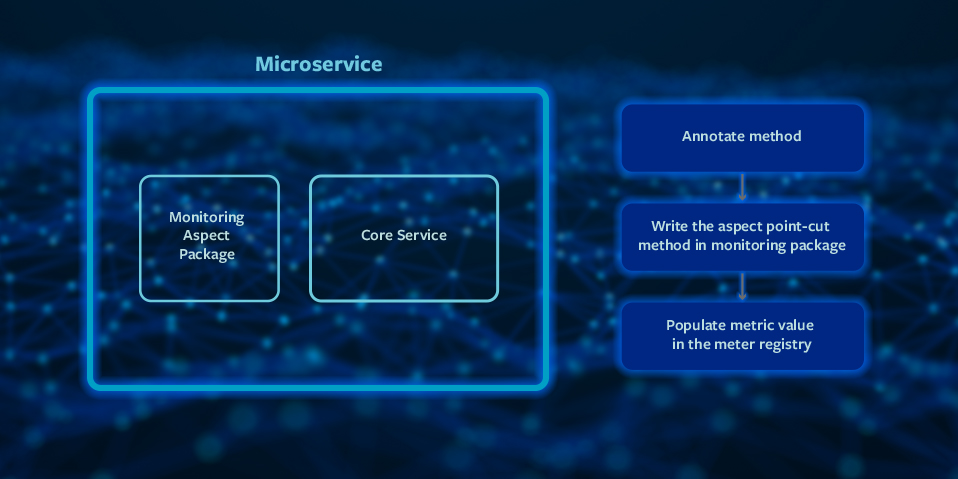 We prefer the AspectJ approach as it allows you to compile the time-weaving of Aspects, which provides better runtime performance. The step we found extremely useful is to annotate service methods requiring: the capture of application-specific metrics; defining the Aspect class separately; defining the Pointcuts against the methods of interest; and then registering the meters in MeterRegistry from inside the Aspect code.
Annotate service business method: Service classes with annotation.
...
@MonitoredService
public boolean createMessage(String topic, BasicMessage basicMessages)
{
    // business logic
    ...
}
Monitoring package with Pointcuts defined: Aspect classes defining Pointcuts against methods of interest.
@Aspect

@Component

public class GatewayServiceAspect {

@Autowired

private MeterRegistry meterRegistry;

public static GatewayServiceAspect aspectOf() {

return SpringApplicationContextHolder.getApplicationContext()

.getBean(GatewayServiceAspect.class);

}

// Define Point Cut for business methods from the service class

@Pointcut("@annotation(MonitoredService) && execution(*

com.messages.EntityMessagesExecutor.createMessage(String, BasicMessage)) && args(topic,basicMessage)")

public void metricsPointcut(String topic, BasicMessage basicMessage) {

}

// Define the metric based on the After trigger for the PointCut method

// Using Meter registry, increment the counter for a specific case defined by labels

// like specific K8S POD instance, K8S deployment name, Tenant/Customer Id etc

@After("metricsPointcut(topic,  basicMessage)")

public void recordMessageCount(JoinPoint jp,String topic, BassicMessage basicMessage) {

Counter metrics_messages = meterRegistry.counter ("gateway_message_received_count",

"instance",”<instance-name>”, "deployment_type", ”<deploy-type>”, "tenant-id", “<tenant-id>”, "message_type", “<message-type>”);

metrics_messages.increment();

}

// Define the metric based on any exception thrown by the PointCut method

@AfterThrowing(value = "metricsPointcut( topic,  basicMessage)", throwing = "ex")

public void catchCreateMesageException (Exception ex, String topic, BasicMessage

basicMessage) {

Counter gateway_metrics_processing_error_count = meterRegistry.counter(

"gateway_message_exception_count", "instance","instance",

”<instance-name>”, "deployment_type",”<deploy-type>”, "tenant-id" , “<tenant-id>”,"message_type", “<message-type>”);

}

}
Using this development pattern keeps a microservice’s business logic clean by simultaneously providing access to the internal structures of the microservice code to enable capture of much deeper levels of application metrics. The approach also eliminates the need to maintain your own collections and caches for counting and averaging, since Micrometer already does that quite reliably.
By leveraging a built-in and widely used telemetry framework like Spring Boot Actuator, you can expose basic Java Management Extensions (JMX) metrics and application-specific metrics easily, with minimal overhead on application developers. By combining this approach with AOP and following the patterns described above, you can keep business logic code clean and easily and efficiently keep telemetry responsibility separate. Using the Spring Boot Actuator supplemented by AspectJ enables you to incrementally satisfy telemetry needs across various large-scale application microservices and still maintain agility in development processes.