Leading vs Lagging Indicators: What's The Difference?

Leading and lagging indicators are terms for statistics you use to measure and manage performance. Both can help you gain an understanding of business conditions and trends.
Below is a simple explanation of leading indicators and lagging indicators, the difference between them, and how to use each.
Indicators are statistics used to measure what may be affecting your business. They’re invaluable when managing business finances, information technology, and the economy.
Various indicators, including lagging vs. leading indicators, give you the insight and context needed for making critical decisions and plans.
Coincident indicators are a category that include key performance indicators (KPIs), which measure your progress in achieving team or company objectives. These might include an increase in service desk tickets marked as resolved, or a decrease in incident reassignment tickets.
Financial services organizations need lagging, leading, and coincident indicators in order to understand their vulnerabilities, and to make decisions about how to drive business continuity, make costs predictable, and facilitate profitable growth.
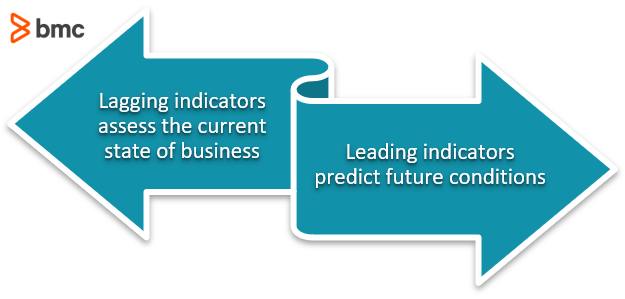 Leading indicators are metrics that predict future conditions. They help you identify and anticipate trends and what might happen to the economy, your industry, your competitors, and your own business or department.
Lagging indicators tell you what has already happened. They measure the magnitude of an aspect of the economy or your business and the degree of change over time in the past.
Leading vs. lagging indicators aren’t about choosing which is better—you need both to stay on course. You need to look where you’re going and also to see where you’ve been in order to stay on track in meeting your enterprise goals and objectives.
 Leading indicators are sometimes described as inputs, because they define what actions you need to take to achieve business goals with measurable outcomes. They “lead” to you meeting business objectives.
A leading indicator encourages business stakeholders to ask:
Leading indicators help you set benchmarks that, if met, show your progress against your KPIs.
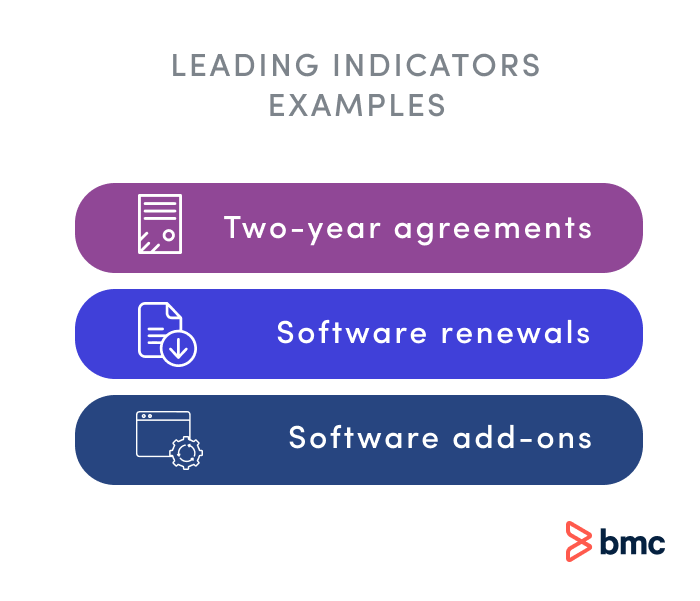
Let’s look at an enterprise business software company with an annual subscription fee. These examples of leading indicators point to the future health of the company:
A leading indicator is a measure of where your business is going. For instance, if you stick to lagging measurements, like revenue, you may completely miss an important, but relatively small, segment of your market that is purchasing add-ons from a competitor instead of turning to you.
By creating a leading indicator measurement, like tracking current customer purchases of add-ons, you can invest in discovering what drives those decisions and why competitors are eating into your business. With insights behind this leading indicator, you can prevent losing business to competitors and potentially spur more customers to consider your software add-ons.
You can’t detect a potential problem or gather the needed insights simply by looking at overall revenue alone. When you have a question that asks you to look into future growth and success, it’s the right time to use a leading indicator.
 Lagging indicators measure up-to-the-moment and past results and performance. While being able to track current trends up to the present time, they do not indicate what you can expect in the future. What they measure is finished, done, and immutable, which is why a lagging indicator is sometimes described as an “output” metric.
A lagging indicator encourages business stakeholders to ask:
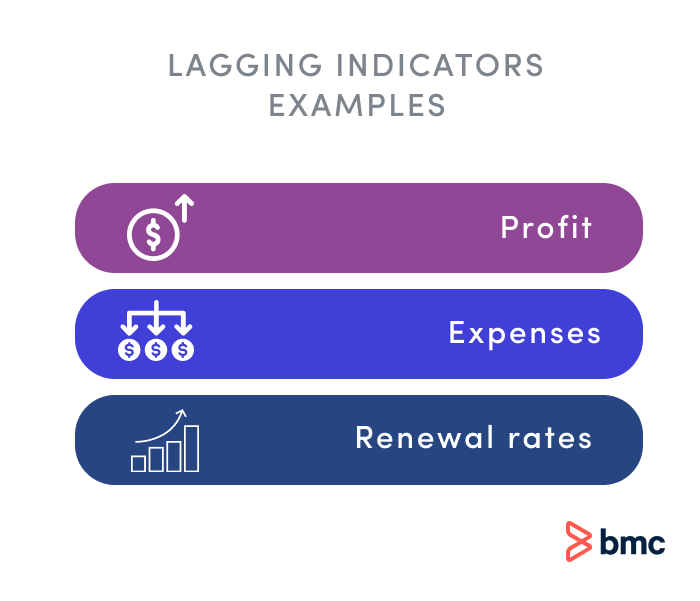
Some lagging indicators examples include:
What lagging indicators measure is generally self-explanatory and easy to understand, versus the more abstract leading indicators.
You can use lagging indicators to measure the outcome of activities, events, product releases, programs, and more. Tracking them over time can show you past trends and potentially cause-and-effect relationships.
Use a mix of lagging indicators and leading indicators to measure outcomes. This task can be made easier with technology that compares leading and lagging indicators, offering insights through automation.
Don’t neglect coincident indicators, which provide context by measuring the current state of the economy in a general sense and within your company. These statistics are the coincident indicators that give you an idea of the circumstances and the environment in which you’re operating.
Is your business slowing? Are your costs increasing? Are you having trouble hiring? Are these issues cropping up because of something your company is doing, or is it something else? Here are some examples of coincident indicators that can help you find the answers:
If business decision makers only look at lagging indicators, they will know what happened, but won’t have enough to go on when it comes to making decisions about the future.
It’s vital to understand the difference between leading indicators vs. lagging indicators and to use both together. For necessary context, you will need to consider coincident indicators about your company’s economic state and the economy at large, as well.
Because leading indicators are harder to measure, yet bring you such valuable insights for the future, you may wish to hire experts. When making forward-looking decisions about IT, BMC can help enterprises continuously optimize their IT resources and predict future needs.
The bottom line is that if you’re using lagging indicators without leading indicators, you’re only getting half of the KPI picture. Lagging indicators are an important resource for creating leading indicators that can launch your business into growth mode, but they aren’t the entire package. These sets of metrics work best in tandem to produce the most accurate and achievable KPIs.