2020 Gartner Magic Quadrant for Data Integration Tools

Each year, renowned IT consulting firm Gartner researches and compiles reports based on their findings of current market trends in a wide variety of industries. Published as Magic Quadrants, these results highlight the top vendors in each category and point out both strengths and challenges they might face.
Although the 2020 Gartner Magic Quadrant for Data Integration Tools isn’t drastically different from past years, the technologies and tools have evolved, giving certain vendors a leading edge against their nearest competitors.
Gartner defines data integration as “a discipline comprising the practices, architectural techniques and tools that allow organizations to ingest, transform, combine and provision data across the spectrum of data types.”
This integration of tools is key to meeting the data consumption requirements of all business processes and applications in the enterprise and beyond. Some examples of technology that would fall under the integration tool umbrella include those that address:
In order to qualify for inclusion in this quadrant, vendors must offer:
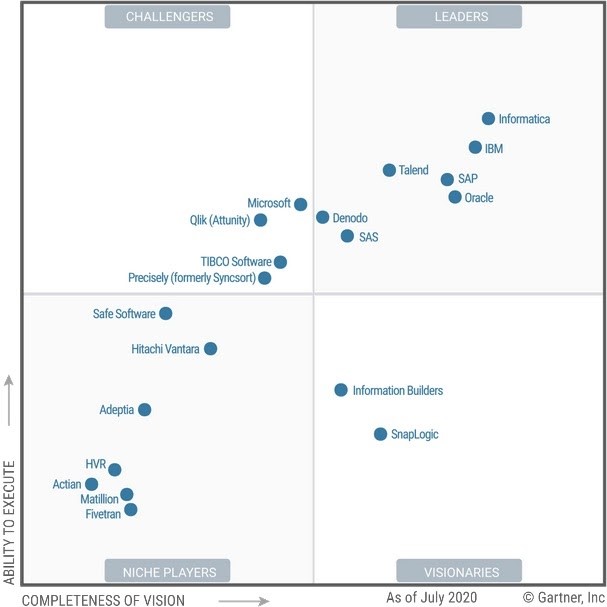
Here is the 2020 Magic Quadrant for Data Integration Tools:
To fully utilize the results of the Magic Quadrant, it’s necessary to understand each category:
With these category definitions in mind, below are the results comparing last year’s Magic Quadrant to this year’s final results.
| 2020 Results | 2019 Results | |
|---|---|---|
| Leaders | Informatica
IBM SAP Oracle Talend SAS Denodo |
Informatica
IBM SAP SAS Oracle Talend |
| Challengers | Microsoft
Qlik TIBCO Software Precisely |
Denodo
Microsoft Qlik |
| Visionaries | SnapLogic
Information Builders |
Information Builders
SnapLogic |
| Niche Players | Safe Software
Hitachi Vantara Adeptia HVR Actian Matillion Fivetran |
Safe Software
Syncsort (Precisely) Adeptia Hitachi Vantara Actian |
Although the three main vendors remain consistent in the Leaders Quadrant from 2019 to 2020, some of the technologies and tools have evolved over the course of the past year.
Holding strong to the top spot in the Leader Quadrant, Informatica doesn’t appear to be sitting complacent at all. With significant investments in a variety of data fabric enabling technologies, it is apparent that the company values its augmented data integration and active metadata services.
Informatica is also responding strongly to the market’s demand for data management convergence capabilities, delivering hybrid/multi-cloud integration and committing to CSP-neutral data integration. With its ability to scale when faced with complex data integration scenarios, it leaves no question as to why it continues to lead in first place.
Not very far behind is juggernaut IBM, who is recognized not only for the scalability and performance of their data integration tools, but also for their superior customer support and expert accessibility. IBM provides a range of traditional and complex upcoming data delivery styles, which offer flexibility in hybrid integration scenarios.
A big challenge the organization faces, however, is confusion due to recent repackaging of its data integration tools, transitioning from the InfoSphere Information Server platform to the IBM Information Server for IBM Cloud Pak for Data. It’s important to note that this process is still in the early stages, so it’ll be interesting to see how customer confidence in the transition might affect the quadrant next year in 2021.
Coming in a close third in the Leader category of this Magic Quadrant is SAP, who stands out thanks to its Integration Solution Advisory Methodology that helps guide customers in the creation of their own unique integration strategy. SAP is known for its seamless data orchestration capabilities, often empowering integration specialists to build and manage cross-system data orchestration.
A few things to take into account when considering SAP are:
Although the main Leaders in the Data Integration Tools Magic Quadrant remained unchanged this year, market demands and organizational needs continue to force vendors to adopt new technologies and upgrade their offerings, benefiting customers and the industry alike.
Want to view more Magic Quadrants? Explore these resources: