Writing SQL Statements in Amazon Redshift

In this tutorial, we show how to write Amazon Redshift SQL statements. Since this topic is large and complex, we start with the basics.
This tutorial will show you how to:
Amazon Redshift is an Amazon Web Services cloud data warehouse that is SQL-based. It is designed to handle large data sets and complex queries. It is ideal for data warehousing, business intelligence, big data analytics, machine learning, and Extract-Load-Transform workflows.
The components of Redshift include the following:
To open the query editor, click the editor from the clusters screen. Redshift will then ask you for your credentials to connect to a database. One nice feature is there is an option to generate temporary credentials, so you don't have to remember your password. It's good enough to have a login to the Amazon AWS Console.
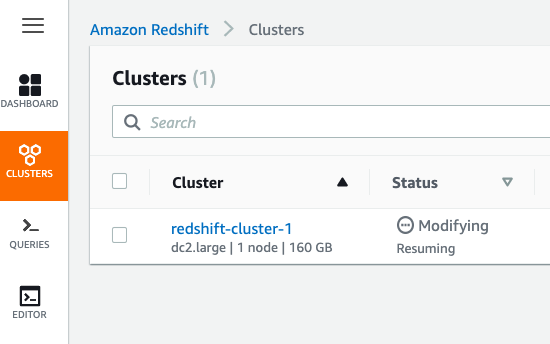
Below we have one cluster which we are resuming after having it in a paused state (to reduce Amazon billing charges).
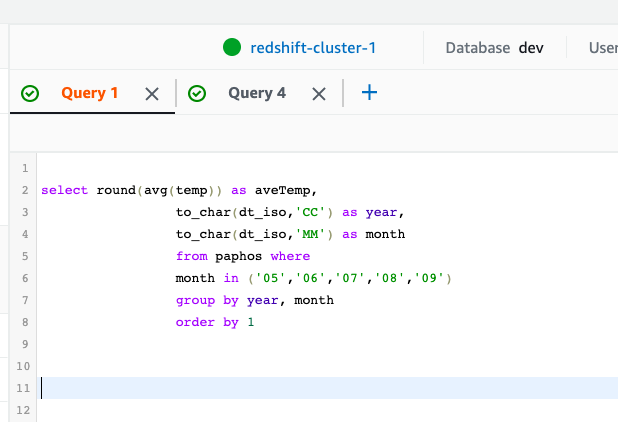
 You write the SQL statement here. Only one statement is allowed at a time, since Redshift can only display one set of results at a time. To write more than one statement click the plus (+) to add an additional tab.
When you run each query, it takes a few seconds as it submits the job and then runs it. So, it's not instantaneous, as you might expect with other products.
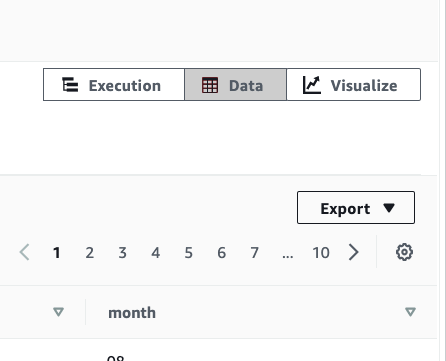
The results are shown at the bottom where you can export those as a CSV, TXT, or HTML. You can also chart the results.
For this tutorial, we use a table of weather data. (See more on loading data to Amazon Redshift from S3.) This is 20 years of weather data for Paphos, Cyprus. It has four columns:
dt_dso is of type timestamp and is the primary key. One nice thing about Redshift is you can load the date in almost any format you want, and Redshift understands that. Then Redshift provides the to_char() function to print out any part of the date you want, like the hour, year, minute, etc.
To look at the table schema query the pg_table_def table.
SELECT *

FROM pg_table_def

WHERE tablename = 'paphos'

AND schemaname = 'public';
Here is the schema.
schemaname,tablename,column,type,encoding,distkey,sortkey,notnull

public,paphos,dt_iso,timestamp without time zone,none,t,1,t

public,paphos,temp,real,none,f,0,f

public,paphos,temp_min,real,none,f,0,f

public,paphos,temp_max,real,none,f,0,f
This query calculates the average temperature per month for the summer months May through September. Notice:
select round(avg(temp),2) as aveTemp,

                 to_char(dt_iso,'YYYY') as year,

                 to_char(dt_iso,'MM') as month

                 from paphos where

                 month in ('05','06','07','08','09')

                 group by year, month

                 order by 1 desc
Here are the results. It shows the hottest months for the 20 years of data. I have cut off the display to make it short. For example, in the 20 years, August 2010 was the hottest month.
We grouped by year then month as we want the month within the year given daily weather observation.
| avetemp | year | month |
| 84.11 | 2010 | 8 |
| 83.12 | 2012 | 8 |
| 83.05 | 2012 | 7 |
| 82.9 | 2015 | 8 |
| 82.39 | 2017 | 7 |
| 82.04 | 2014 | 8 |
| 81.85 | 2007 | 7 |
| 81.73 | 2020 | 9 |
| 81.72 | 2013 | 8 |
| 81.72 | 2008 | 8 |
| 81.62 | 2000 | 7 |
| 81.61 | 2009 | 8 |
| 81.49 | 2017 | 8 |
We export the data to a csv format using the button to the right of the results. Then we import it to a spreadsheet so that we can more easily see the results and give it colors and such.
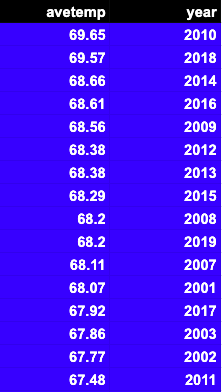
 Here are the hottest years. We get that by dropping the month from the aggregation.
select round(avg(temp),2) as aveTemp,

                 to_char(dt_iso,'YYYY') as year

                                    from paphos

                                                group by year

                 order by 1 desc
For more tutorials like this, explore these resources: